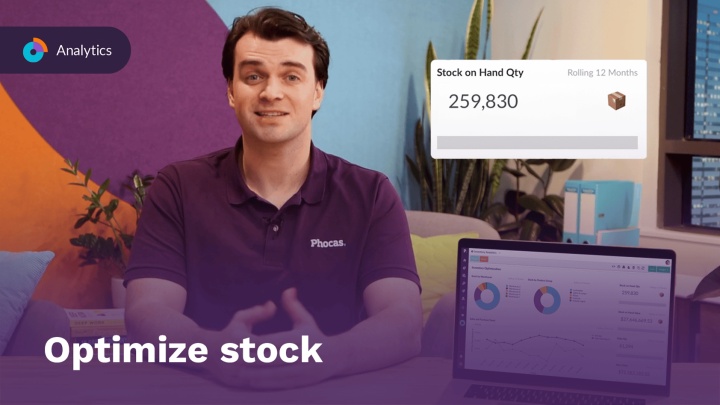
Real-time stock metrics for confident action

Build inventory dashboards tailored to your role
The inventory story changes depending on who is reading the information. Operations need stock levels for reordering and sales need availability by product. Finance care about the cash conversion impact whereas the COO wants a summary of everything. Phocas allows every person working across different teams to have customized dashboards.

Customer quote
I sit down with a supplier partner and show them in black and white how they are performing. We look at Phocas inventory dashboards and KPIs. Our suppliers are just as impressed as me at how nimble and easy it is to get the data.
Infor + Phocas customer
Measure vital industry metrics plus bespoke KPIs for your business
-
number of days of supply
-
DIFOT (delivered in time on full)
-
units sold
-
inventory value
- stock to sales ratio
All of the standard industry inventory metrics are built and ready for your dashboards. If you want to measure GMROI by one product or via multiple product lines, this is also easy to do and all inventory metics can be added to your financial statements and budgets.

Data-driven inventory decisions are easy
Automate updates to dashboards and flash reports for all stakeholders to drive informed decisions and confidence across your business.
- Stock level monitoring – automate tracking of inventory levels in real time to prevent stockouts and overstocking.
- Reorder point alerts – trigger replenishment notifications when products reach minimum stock thresholds.
- Inventory performance analysis – automate reporting on key metrics like inventory turnover to improve decision-making.

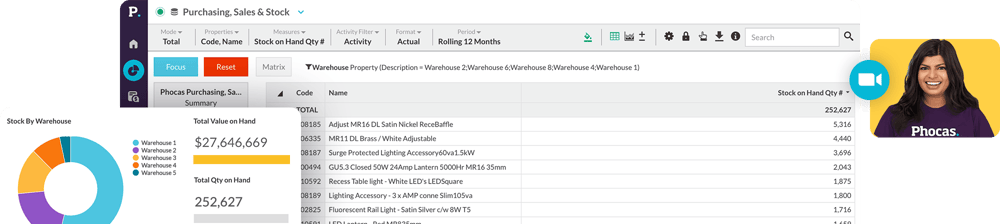
See what's selling, know what to buy
- View rolling 12-month sales alongside current stock on hand by product and location
- Calculate months cover instantly to know exactly how long your current stock will last
- Spot which products, categories or warehouses need attention before stock runs out
- Automate complex inventory calculations in a few clicks – no spreadsheets needed
- Give purchasing and finance shared, real-time visibility for confident stock decisions
Smart inventory management
"Phocas has helped us to analyze stock that isn't moving or is moving slowly, so we can move stock around to make the best use of it. This also helps us ensure our suppliers are stocking the right products for us or to plan our deliveries proportionately."
— Mark Law, IT Director at Hayley Group.

Connected inventory visibility across your business
Reducing dead stock depends on visibility you can trust. Phocas connects to your existing ERP and surfaces aging inventory, slow movers and stock risk in one connected view – giving your purchasing, finance and operations teams the shared picture they need to act.


The inventory visibility you need for confident action
Your inventory story changes depending on who’s reading it
Download now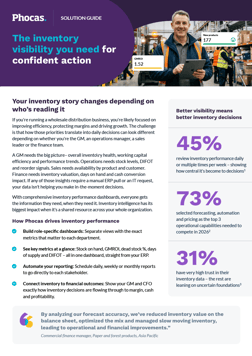
Understand the past, operate better today, and plan well for the future