Inventory performance across every location

When every location feeds into one view, decisions get easier
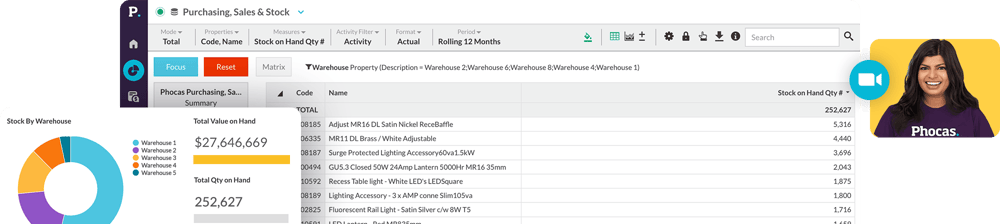
Phocas connects to your ERP and brings every location's inventory data into one place — updated automatically, no manual consolidation required. What used to take a day of spreadsheet work becomes a single view your whole team can access and act on.
Your purchasing team stops making network decisions from incomplete data. Your branch managers stop waiting for reports. And the stock imbalances that used to build quietly across sites start surfacing early enough to do something about them.

Customer quote
"My motto is, if you can see it, you can do something about it. I’m absolutely convinced that our ability to see and understand different elements of what is happening in the business, and our ability to list and prioritise them, has been made possible by Phocas. Now we do it with ease."
Filter down. Drill in.
See it across every site
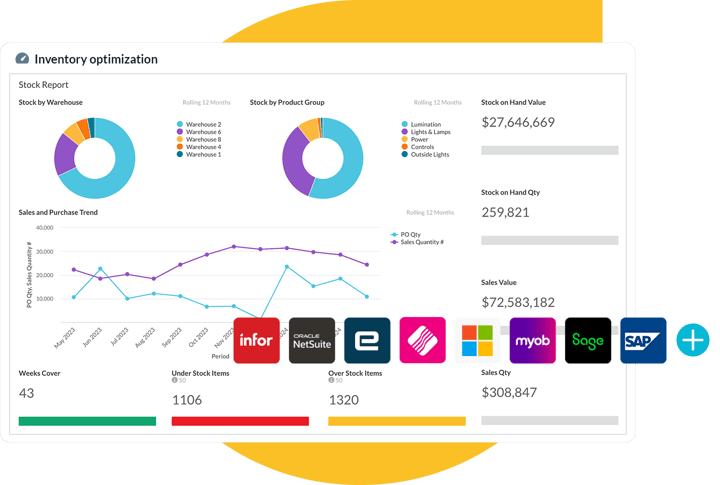
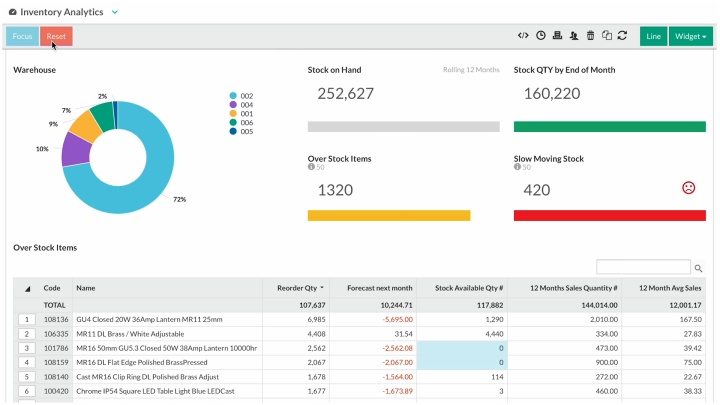
Open your inventory database in Phocas Analytics and you're looking at your whole network in one view. Filter to a single warehouse to see its stock position, drill into an issue at SKU level, then switch dimension to see how that same issue compares across every location — all without leaving the screen or pulling a new report.
- Stock levels by location: See what's on hand, committed and available at every warehouse in one view
- Filter and drill by location: select a warehouse or branch to see its stock position, then drill to product or supplier level
- Identify dead stock: Combine inventory and sales data in Analytics to surface slow-moving product by location
50 branches.
One source of truth
"Across our fifty branches, people are using Phocas to identify opportunities; what are the gaps in the branch? What are we selling? What are we not selling? Are there particular salesmen that are good at selling certain products and not other products?"
— Mark Law, IT Director at Hayley Group.

Consolidate financials
across entities and currencies
For distributors with subsidiaries or operations across borders, Phocas Financial Statements handles multi-entity consolidation and multi-currency reporting in your P&L, balance sheet and cash flow — removing the manual work and the risk of errors that come with it.
- Stock levels by location: See what's on hand, committed and available at every warehouse in one view
- Days of supply comparison: Compare cover across locations using actual sales history – not averages
- Stock turns by branch: identify locations where inventory is moving slowly and capital is tied up
- Dead stock by site: Surface excess and slow-moving product across all locations before it becomes a write-off
- DIFOT tracking: Monitor supplier on-time delivery rates across your whole network from one view

Customer quote
“Our data in Phocas, combined with our retail partners' sales data lets us plan inventory to place the right commitments with our resources and vendors overseas. This allows us to make sure we're holding the right number of weeks stock domestically to meet demand. It ensures that we are running a profitable business.”
Make every purchase count
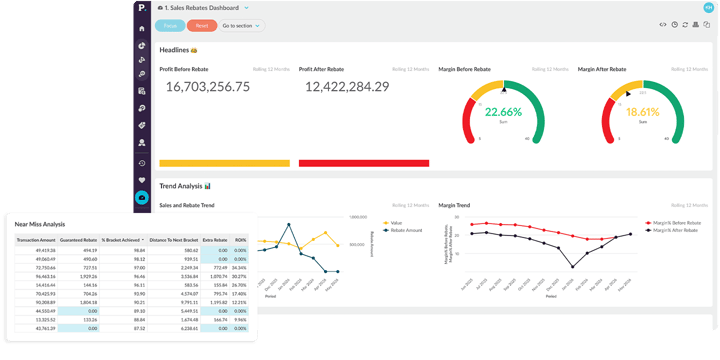
For multi-location distributors, supplier rebates are a meaningful part of margin — not a bonus. But tracking progress toward rebate thresholds across multiple branches in a spreadsheet means you're almost certainly leaving money on the table. Phocas Rebates connects to your purchases data across all locations, automates calculations and shows your purchasing and finance teams exactly where you stand before the period closes.
- Supplier rebate tracking: Automate calculations across volume tiers, spend thresholds and fixed or percentage rules
- Near-miss analysis: See exactly how close you are to the next rebate tier and adjust purchasing decisions before the period closes
- Accrual reporting for finance: Give your finance team a governed, attributable view of rebate accruals; no more end-of-period spreadsheet reconciliations
-
True net cost visibility: Compare profit margins by supplier, product and branch before and after rebates
Customer quote
"One of our reps was using Phocas in real time in front of a customer. They saw immediately that he was just below another rebate break band, so he straight away upped his order by £2,000 to take him into that next rebate level. We wouldn’t have had that instant win without easy access to rebate data in Phocas!"
Drive inventory performance across every location
Managing multiple locations multiplies your data challenges
Download now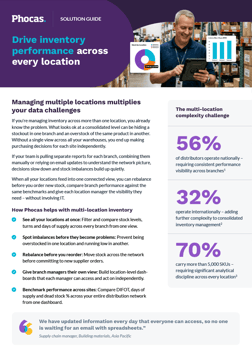
One platform, every location connected
Managing inventory across multiple locations touches every part of your business – from what you buy and where you hold it, to how it flows through your financials and what it means for your supplier relationships. Phocas brings all of it together in one platform, so your purchasing, finance and operations teams work from the same picture, across every site.



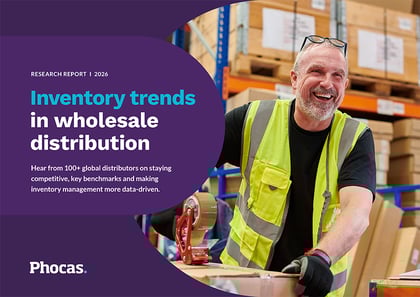
Inventory trends in wholesale distribution
If products and supply chains are part of your working day – this new trends report is a must read.
Understand the past, operate better today, and plan well for the future