See stock clearly, act before problems build

Most inventory decisions are
made with incomplete data
The data from our 2026 Inventory Trends in Wholesale Distribution Report tells a consistent story: when inventory data is disconnected or out of date, the costs are real — even when they're invisible.
Don't know their inventory days of supply – can't manage what you can't measure
Lose sales from not having the right stock available – the cost of acting late
Hold more than 90 days of stock – working capital that could be elsewhere
Why visibility breaks down in distribution
You don't have a data problem, you have a data access problem. Your ERP holds everything you need. The gap is getting it into a form your team can act on, at the moment they need it. Here's where most distribution businesses lose the picture.
Your ERP holds real-time data. But if your stock reporting is a manual export or a spreadsheet refreshed weekly, every purchase order, pricing decision and customer commitment is made on data that's already out of date. The gap between what you think you're holding and what you're actually holding widens a little more every day.
Category-level stock reports hide what's actually happening. Knowing a product class looks "well-stocked" on average tells you nothing about the three SKUs that will run out next week or the twelve lines that have been sitting for four months. Without stock cover tracked at the individual product level against actual sales velocity, you're averaging away the problems.
When each team pulls its own report from the same ERP, they're rarely looking at the same picture. Purchasing sees stock by quantity. Finance sees it by value. Sales doesn't see it at all until a customer asks. Decisions made from three different views of the same inventory create overstock in some areas, stockouts in others — simultaneously and invisibly.
Standard inventory reports show you what you held last month. They don't show which products will run out before your next supplier order arrives. Without projected stock levels set against real demand and actual lead times, risks build quietly until they're already a stockout — or a write-off.
One accurate view – purchasing, sales, stock
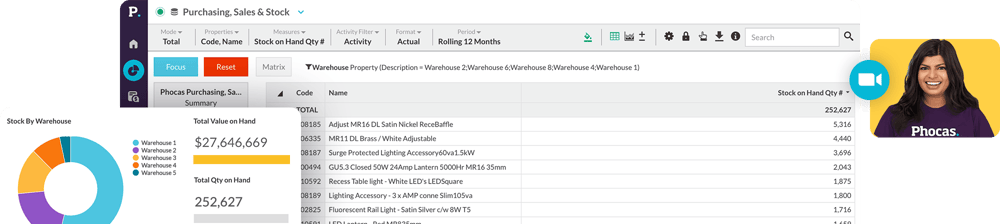
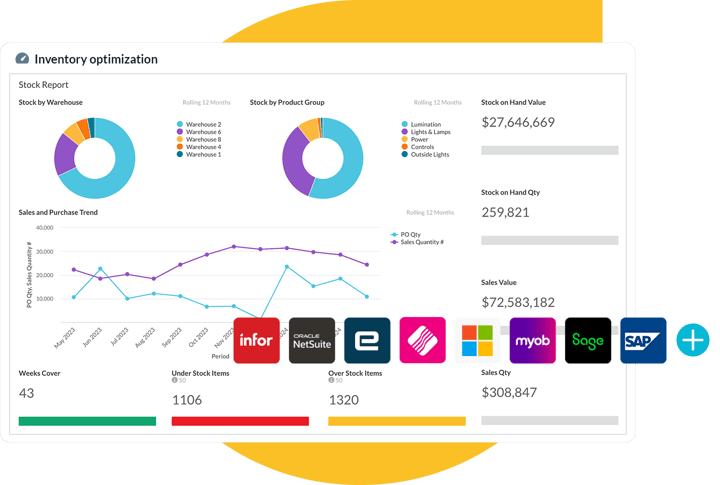
Phocas connects directly to your ERP and pulls sales, purchasing and inventory data into a single up-to-date view — refreshed automatically, no manual export required.
Your team can filter by product, warehouse or supplier in seconds and see weeks of cover, stock on hand and sales quantity together in one place.
When purchasing, sales and finance all work from the same up-to-date numbers, the conversations that used to start with "whose data is right?" stop happening.
Customer quote
"My motto is, if you can see it, you can do something about it. I’m absolutely convinced that our ability to see and understand different elements of what is happening in the business, and our ability to list and prioritise them, has been made possible by Phocas. Now we do it with ease."
Know what you're holding
and for how long
- See your real stock position: Up-to-date ERP data shows exactly what you're holding, where and for how long – updated automatically, no manual export required
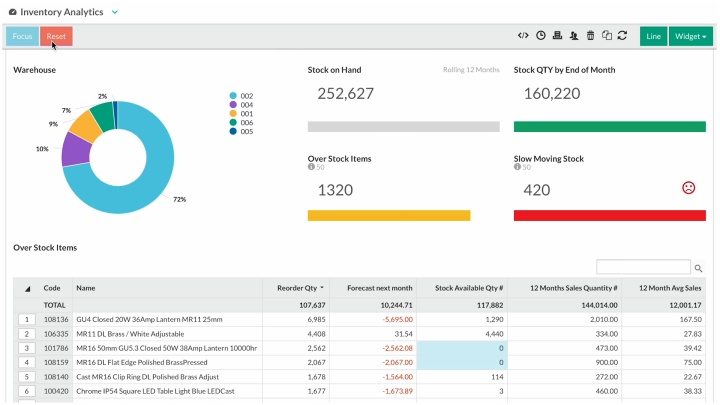
- Identify overstock lines: Surface the products where your stock coverage far exceeds your actual sales rates and free up the capital they're tying up
- Align your teams: Give purchasing, sales, finance a shared, up-to-date view, so everyone understands the numbers behind decisions
Filter down. Drill in.
See it across every site
Open your inventory database in Phocas Analytics and you're looking at your whole network in one view. Filter to a single warehouse to see its stock position, drill into an issue at SKU level, then switch dimension to see how that same issue compares across every location — all without leaving the screen or pulling a new report.
- Stock levels by location: See what's on hand, committed and available at every warehouse in one view
- Filter and drill by location: select a warehouse or branch to see its stock position, then drill to product or supplier level
- Identify dead stock: Combine inventory and sales data in Analytics to surface slow-moving product by location
Stock visibility across 50 branches
Hayley Group manages inventory across a national branch network with thousands of SKUs. With Phocas, the team can see slow-moving stock across every branch in one view and act on it; redistributing stock between locations before it becomes a write-off and giving suppliers cleaner, more accurate demand signals.
Plan purchases around what's actually selling
Knowing what's on the shelf today is only half the picture. Phocas Budgets & Forecasts connects your sales forecasts, current stock on hand and purchasing data into a single demand plan — so your team can see projected stock levels by supplier, product class or SKU, period by period.
- See stock month by month: Each month's closing stock is calculated automatically and carries forward as the next opening balance
- Proactively spot shortages: See when stock is getting low or going negative so you can act before is affects customers
- Factor in supply lead times: Add lead time data to your plan so you know exactly when to make orders

Customer quote
“Our data in Phocas, combined with our retail partners' sales data lets us plan inventory to place the right commitments with our resources and vendors overseas. This allows us to make sure we're holding the right number of weeks stock domestically to meet demand. It ensures that we are running a profitable business.”
Visibility that reaches further
than stock on hand
Stock visibility isn't just knowing what's on the shelf. It's understanding what it cost, what it's worth to customers and what it means for supplier relationships. Here's how the rest of the Phocas platform connects.
Factor rebates into stock decisions
Supplier rebate agreements affect what you should buy and in what volume — but most purchasing decisions are made without that context. Phocas Rebates tracks near-miss rebate tiers so your team sees exactly how close you are to the next bracket and what it's worth before placing an order.
Buy to demand, not to history
Historical averages miss customers who are growing, churning or changing their buying patterns. Phocas Insights uses RFM analysis to segment customers by recency, frequency and spend, so your team can adjust purchasing plans around real behaviour, not last year's numbers.
Keep sales reps in the picture
When reps walk into a call without knowing what a customer has ordered or how recently, opportunities get missed. Phocas CRM keeps customer activity, account history and pipeline in one mobile-friendly view, connecting to Analytics so every call is better informed.
Customer quote
"One of our reps was using Phocas in real time in front of a customer. They saw immediately that he was just below another rebate break band, so he straight away upped his order by £2,000 to take him into that next rebate level. We wouldn’t have had that instant win without easy access to rebate data in Phocas!"
One platform, every inventory decision connected
Stock visibility starts with a live connection to your ERP. Phocas Analytics is the foundation – but inventory decisions touch every part of your business. The full platform connects them all.
Inventory trends in wholesale distribution
If products and supply chains are part of your working day – this new trends report is a must read.
Frequently asked questions
Stock visibility is your team's ability to see accurate, up-to-date inventory levels — by product, location and rate of sale — at any point in time. Without it, purchasing decisions are made on stale data, leading to stockouts in fast-moving lines and excess in slow ones. For distributors managing thousands of SKUs across multiple locations, the inability to see stock clearly is typically the root cause of both problems — excess inventory and lost sales — happening at the same time.
Stock availability is the outcome; having the right product ready when a customer needs it. Stock visibility is the capability that makes it achievable — knowing exactly what you're holding, how long it will last at your current rate of sale and how it lines up with real demand. Most distributors focus on availability as the goal but lack the visibility to achieve it reliably or consistently.
Weeks of cover measures how many weeks your current stock on hand will last at your current rate of sales. In Phocas Analytics, it is calculated from stock on hand quantity and sales quantity data pulled directly from your ERP. You can view weeks of cover at a product, product class, warehouse or supplier level, making it easy to see which lines need attention and which are well-stocked, without averaging across categories.
Phocas connects to over 200 data sources including ERP systems like Epicor, Infor, SAP, Sage, NetSuite, Microsoft Dynamics and MYOB. Your ERP data populates Phocas databases (such as a purchasing, sales and stock database) which refresh on a scheduled basis. Once set up, data flows automatically — your team doesn't manage the integration after implementation. The typical implementation timeline is 8–12 weeks from sign-off to go-live.
Phocas connects to over 200 data sources including all major ERP platforms used by distributors — Epicor, Infor, SAP, Sage, NetSuite, Microsoft Dynamics, MYOB and more. The connection is set up during your implementation (typically 8–10 weeks) and data flows from your ERP into Phocas automatically. Your team doesn't need to manage the integration after setup.
Phocas typically takes 8–10 weeks from sign-off to go-live. During implementation, your team works with Phocas to configure databases, build your inventory dashboards and set up user access by location. Most customers are up and running in approximately 10 weeks, with a dedicated Phocas consultant managing the technical setup throughout.
Understand the past, operate better today, and plan well for the future