Work more efficiently
9:39 minutes total learning time
This module takes you through key grid customization features in Phocas. These videos help you tailor your workspace and improve how you work with data.
Phocas product  Analytics
5 videos in this learning module
1
Get more options for viewing data
2:20
2
Change the data format
1:47
3
Gain more screen space and other tips
3:20
4
Set your default period for a database
0:53
5
Phocas AI
1:19


5 videos in this learning module
1
Get more options for viewing data
2:20
2
Change the data format
1:47
3
Gain more screen space and other tips
3:20
4
Set your default period for a database
0:53
5
Phocas AI
1:19
Get more options for viewing data
Looking for a different perspective? In this video, discover options like "Show Others," "Show Average," "Hide Total," "Totals as Average," and "Show Net Zero." These one-touch features make it easy to explore your data in new ways and satisfy your curiosity.
Supporting documentation
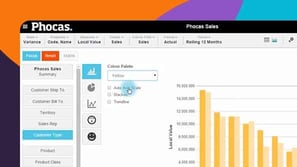
Change the data format
Learn how switching from actual figures to percentage share view can instantly reveal discrepencies between sales value and profitabilty.
Supporting documentation
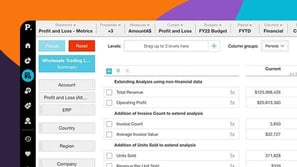
Gain more screen space and other tips
Learn how to streamline the grid for extra screen space and explore useful features like freezing the properties column, copying and pasting data, and various export options.
Supporting documentation
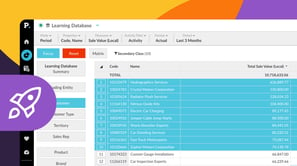
Set your default period for a database
The default period is the timeframe you first see when you open a database, set by an administrator to give you access. If it doesn't work for you, you can change it for your account, so your preferred date range shows up every time you open the database.
Supporting documentation
Phocas AI
Phocas AI makes it easy to get quick answers and insights by letting you ask questions that relate to your business databases. This is especially useful for new or occasional users who might not be familiar with all the features. You can ask questions in your own words and see the steps taken to get the results, helping you learn along the way.
Supporting documentation
Phocas product

Related learning modules
Get started with Analytics
This module for beginners takes you through getting started in Phocas Analytics and doing some simple analysis to get fast results from your data. These videos introduce you to features that you will be using every day.
7 videos
15:33 min

Explore and analyze data
Learn how you can explore and analyze your data in Phocas Analytics. Discover how to compare data, refine your view, and use advanced tools to uncover insights and understand performance.
10 videos
25:30 min
View data in charts and dashboards
Switching from grid to chart view opens up options for various graphical presentation of your data. This module covers basic chart setup through to advanced configuration, with a detailed look at some chart types.
6 videos
14:04 min
Answer important business questions
This module takes you through how to answer key business questions in Phocas Analytics. These videos cover analysing sales, tracking performance, managing inventory, and identifying opportunities using your data.
7 videos
14:53 min