Get started with Analytics (Classic)
5 videos in this learning module
Work with the grid (Analytics Classic)
Focus on data
Change the period (Analytics Classic)
Change the mode
Save a favorite
5 videos in this learning module
Work with the grid (Analytics Classic)
Focus on data
Change the period (Analytics Classic)
Change the mode
Save a favorite
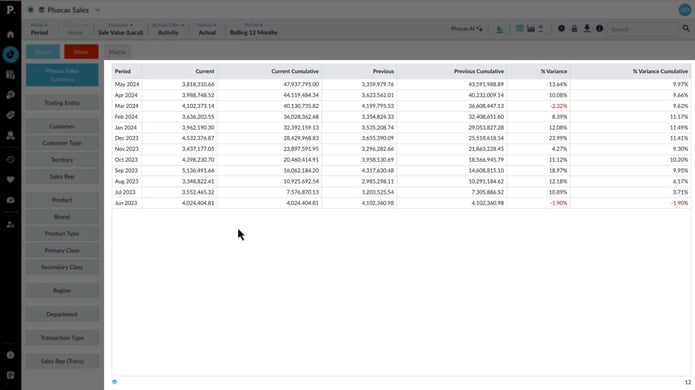
Work with the grid (Analytics Classic)
Learn how to open a database and understand what you see, from the summary view to the saved view of a favorite or alert. You'll get to know the grid, the dimensions, and the options along the top, and how to chart or export your results, save a favorite, create an alert, add to a dashboard, or set a default view.
Supporting documentation
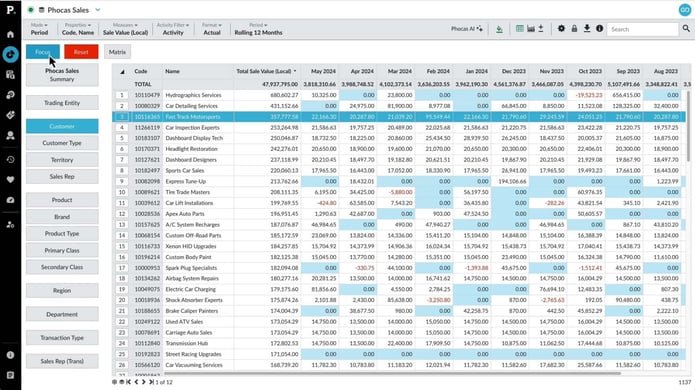
Focus on data
Learn how to start from the dimensions on the left and use Focus to isolate specific data as you explore. You'll narrow from a customer to a product type to individual products, see your selections as filters at the top of the screen, and use Reset to clear them and start over.
Supporting documentation
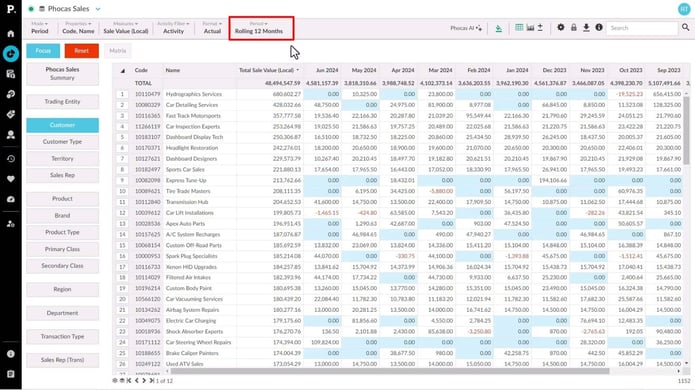
Change the period (Analytics Classic)
Learn how every figure in the grid is tied to a period, which sets the date range and the basis for comparing current and previous values. Choose a predefined period, check the dates it uses, and, with the right permissions, apply a temporary custom period or save a user defined period with fixed or dynamic dates. You can also change a database's default period from the homepage.
Supporting documentation
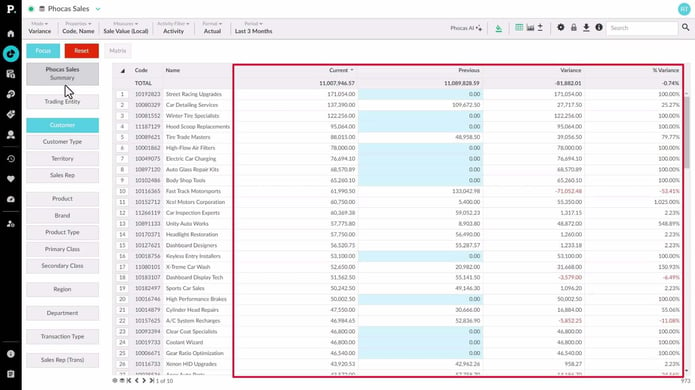
Change the mode
Learn how modes work as predefined views that show particular columns in the grid. Switch from the default period mode to Variance to compare current and previous period performance side by side, or isolate a customer and use Transaction mode to see the individual transactions behind their results. Some modes, such as Variance, are only available when a dimension is selected and you're in a filtered view.
Supporting documentation
Save a favorite
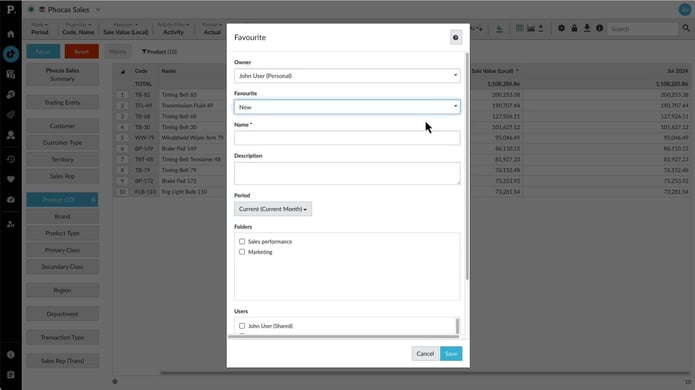
Learn how to save a favorite from a view you've set up, such as the top ten products for the current month. You'll name it, add a description, choose the period it opens in, and share it with folders or specific users, then find it again in the menu or on your homepage.
Supporting documentation

Related learning modules
 Analytics (Classic)
Explore and analyze data
 Analytics (Classic)
View data in charts and dashboards
 Analytics (Classic)
Answer important business questions
Analytics (Classic)