Walk in already briefed
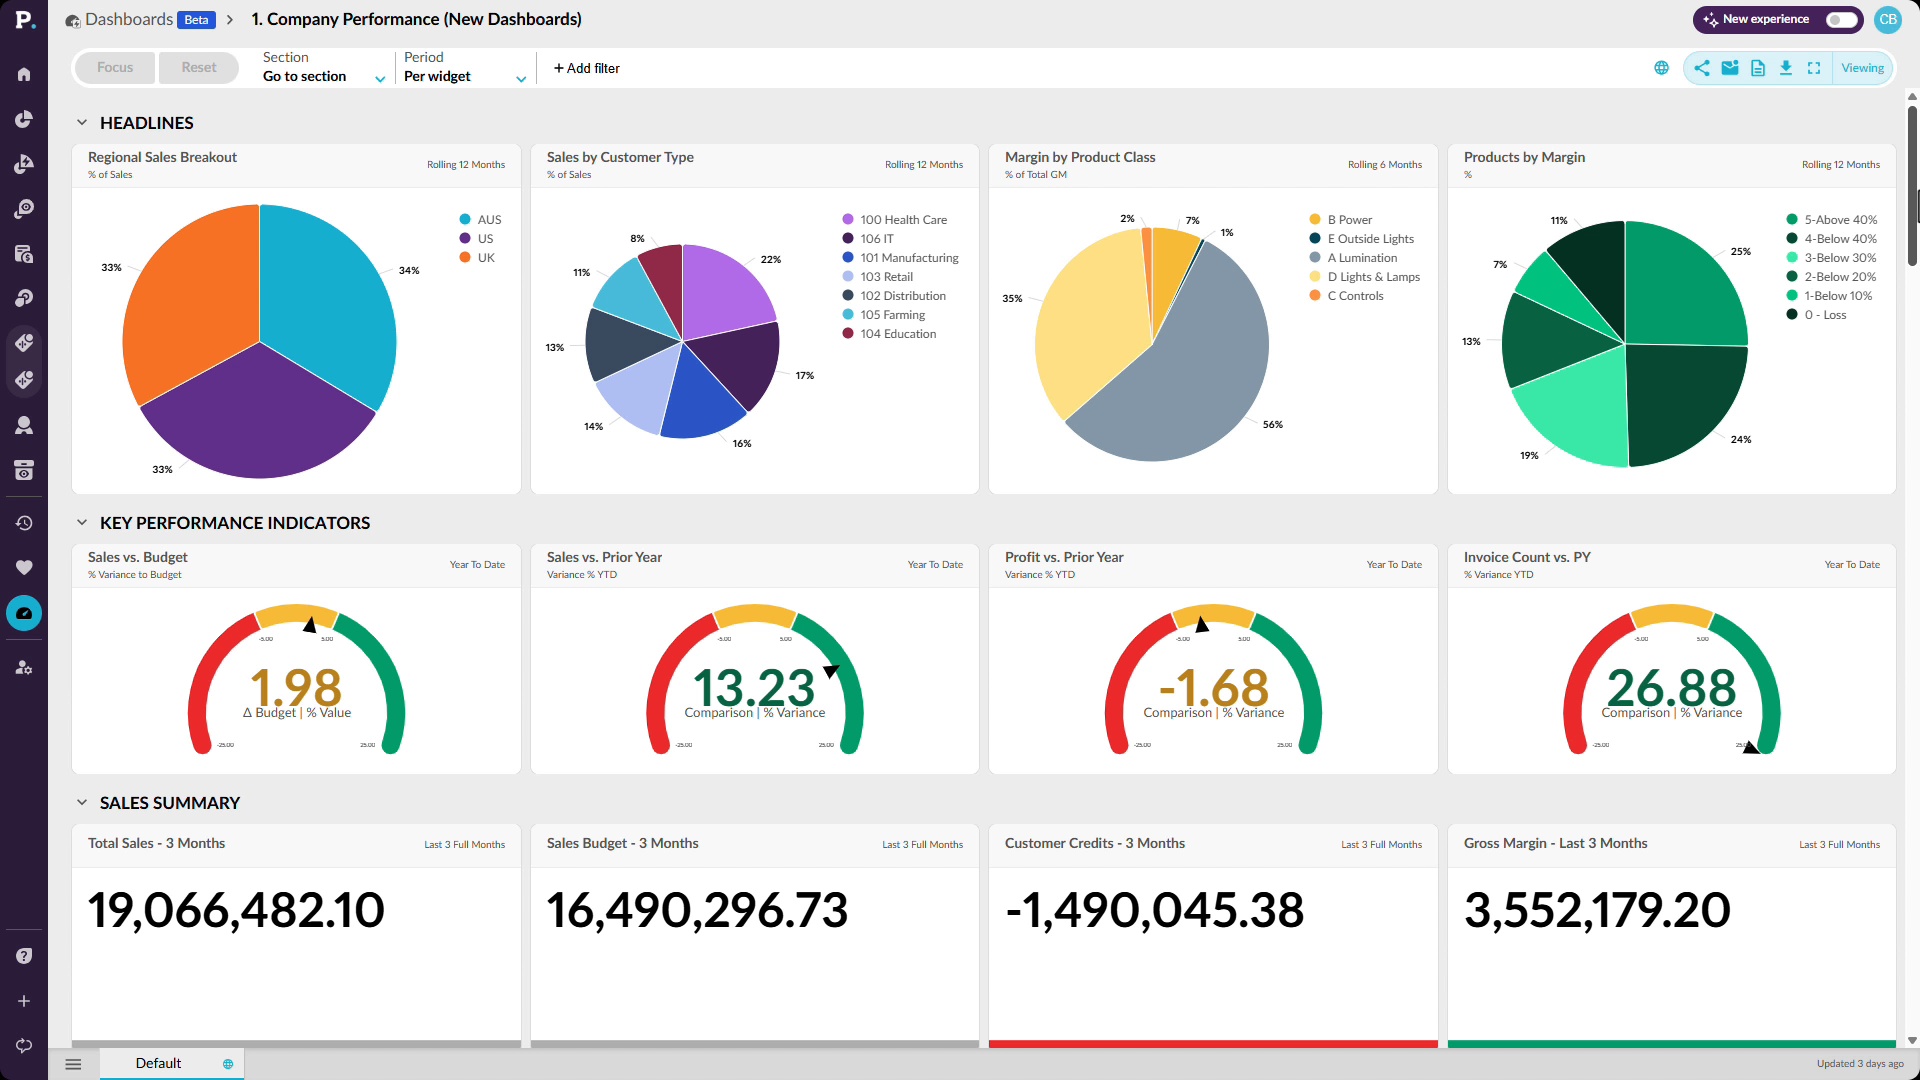
Get ready for reviews without spending hours chasing numbers, waiting on reports, or piecing information together. See how a dashboard brings KPIs from across the business into one place, including sales to budget, profitability, customer credits, quote conversion, rep performance, inventory, and finance. You’ll also see how to focus the entire dashboard on a region, add filters such as product class, and drill into the data behind a result when something needs more attention. This gives you a faster way to answer your own questions and walk into a meeting with the detail already at hand.
Supporting documentation
 Analytics

Related video tutorials
 Analytics
Catch an off-track rep in time
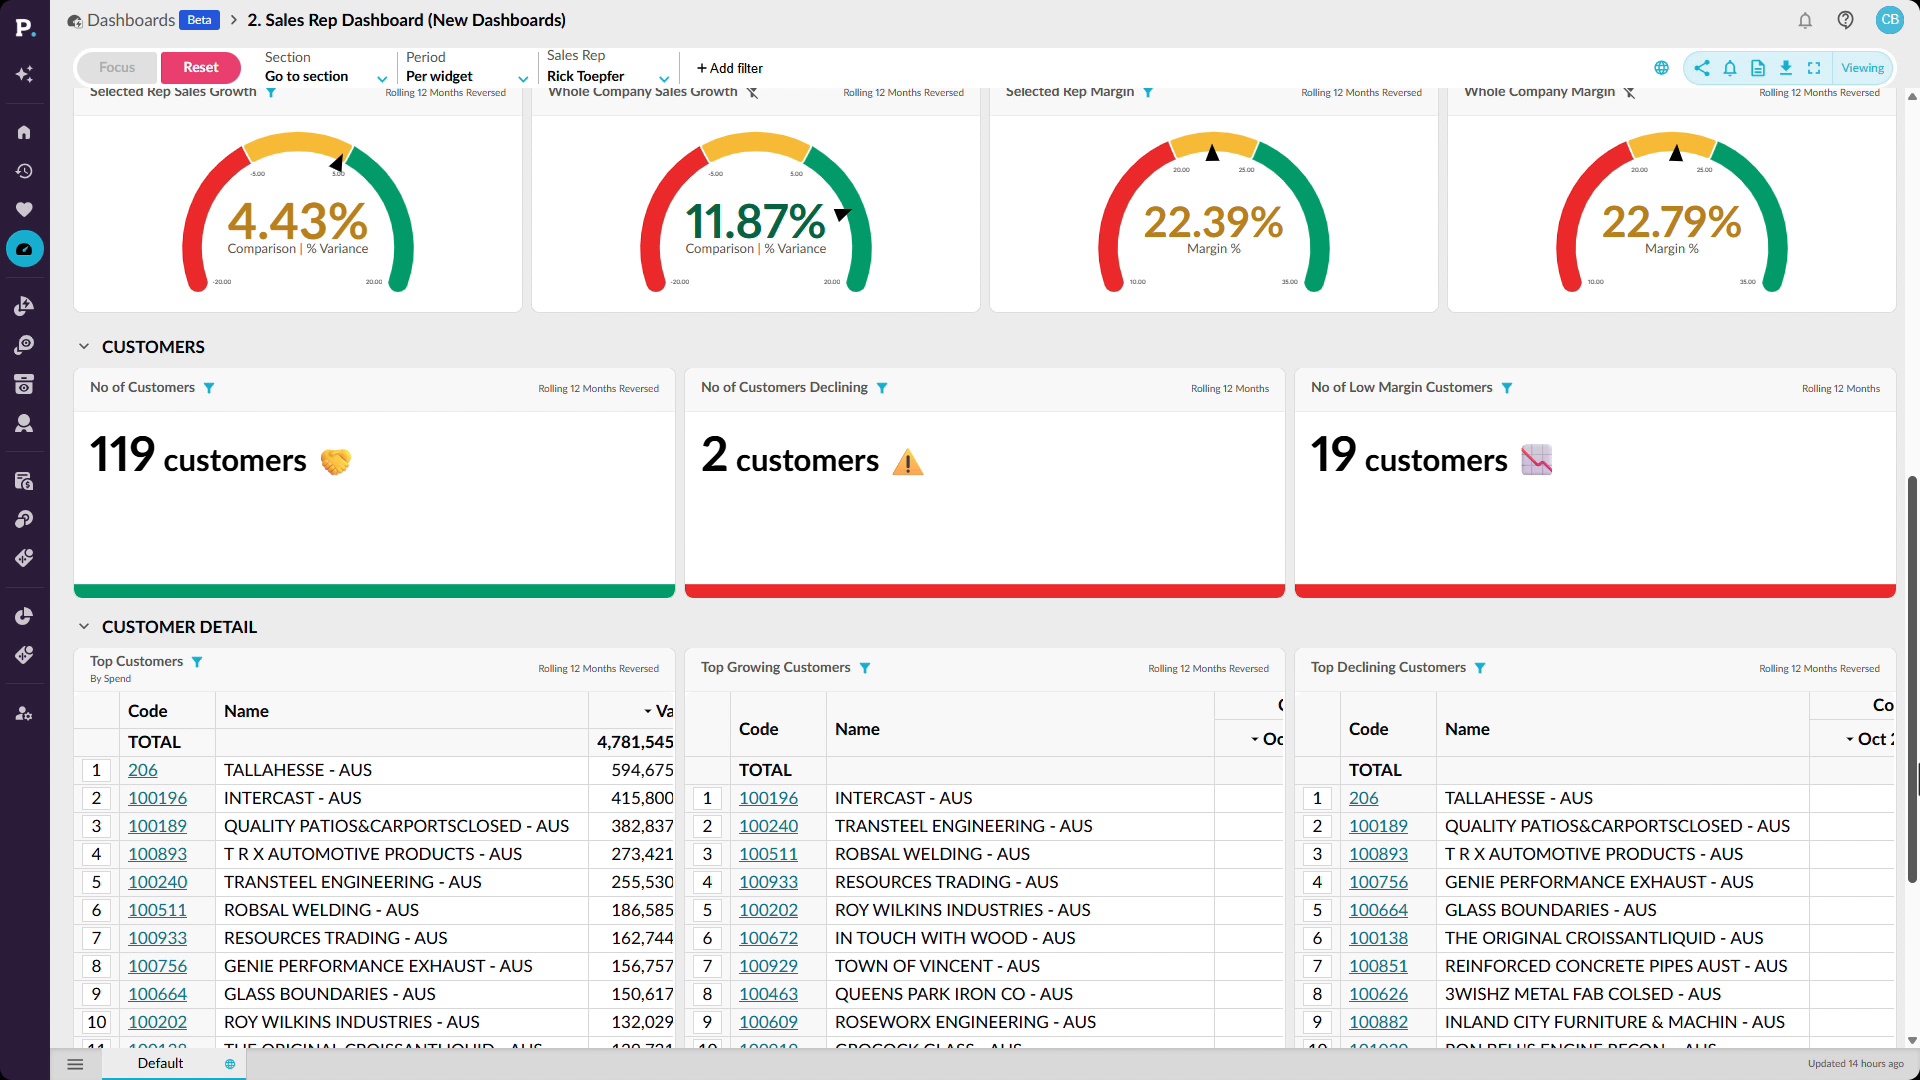
Use dashboards and detailed analysis to see how sales reps are performing against budget or quota. Start with a high-level view of performance, then filter the dashboard for an individual rep and change the reporting period to compare sales with budget year to date. From there, you can investigate where performance is falling behind and save, share, or add the results to a dashboard. This makes it easier to spot issues early and focus attention on the reps who may need support.

 CRM
Use the CRM analysis dashboard
 Platform
Use dashboards
 Analytics
See margin next to every sale
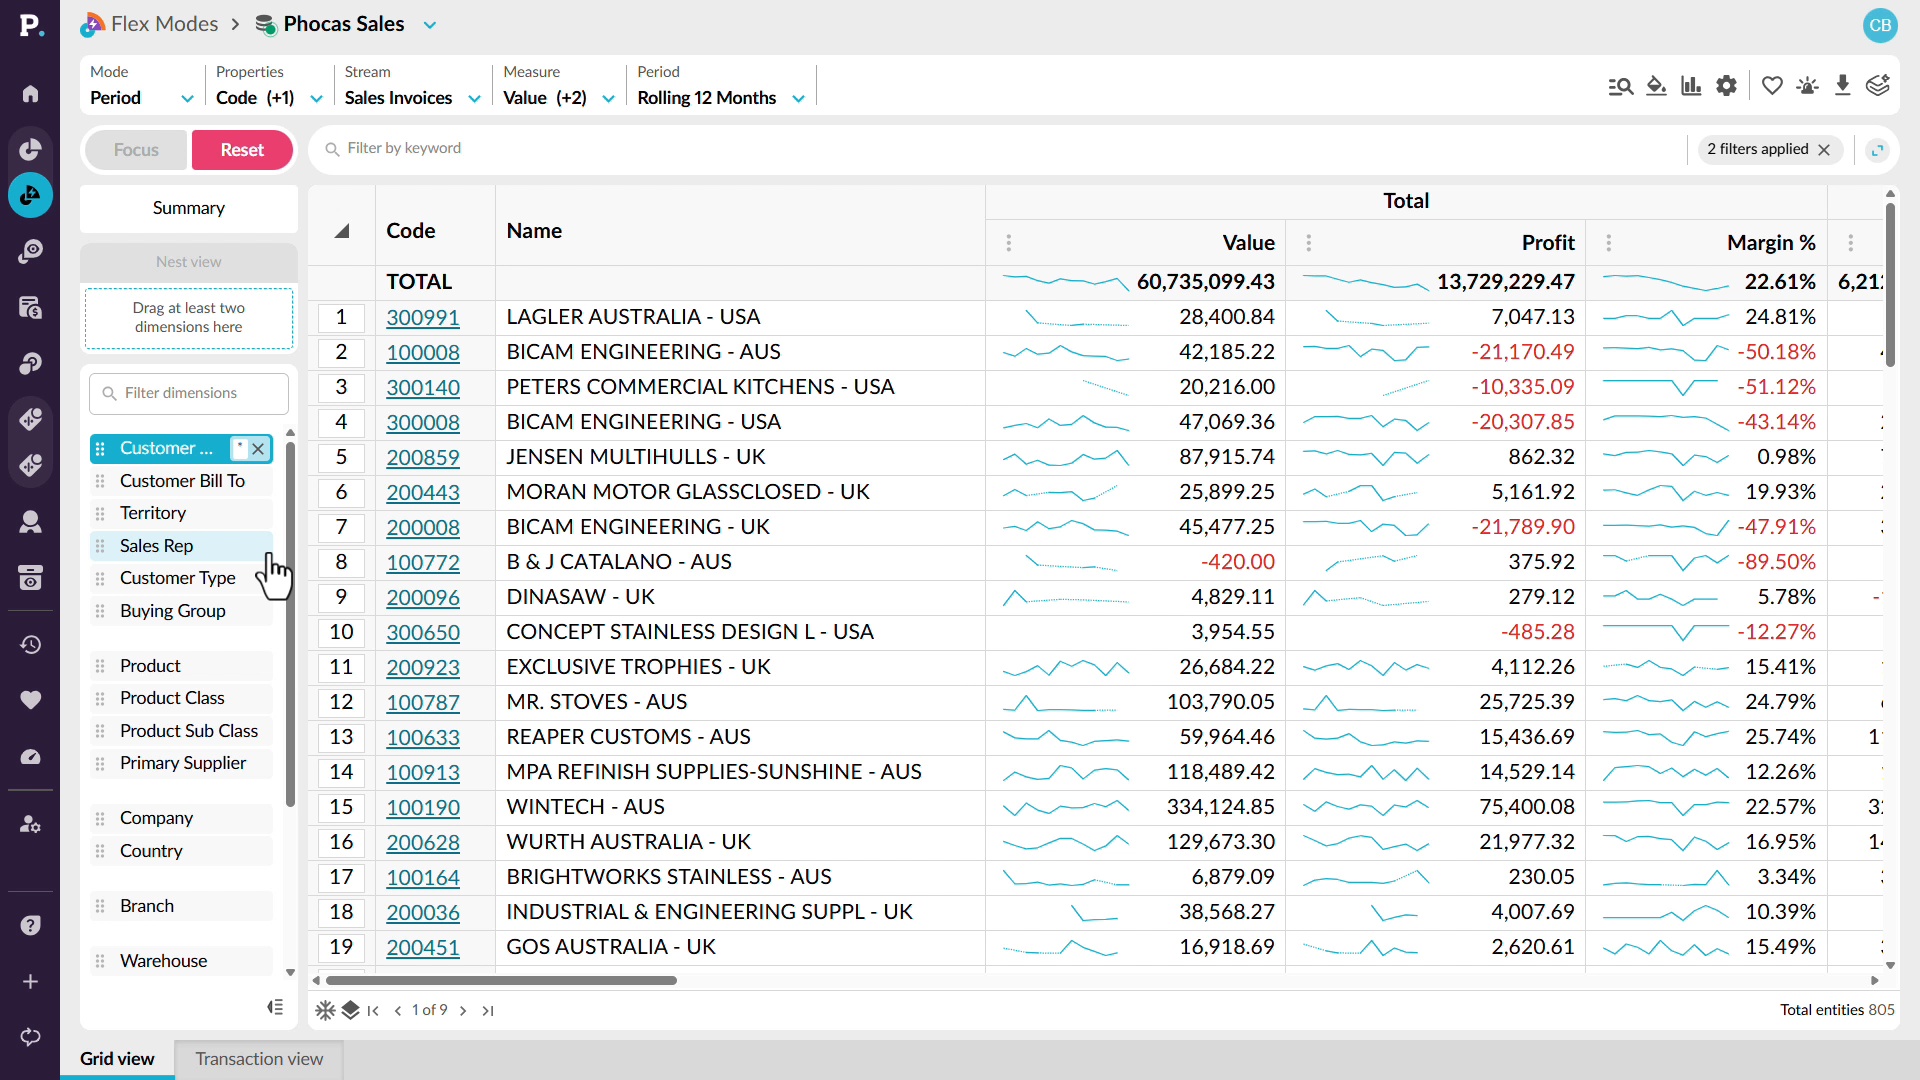
Look beyond sales revenue to understand the profitability behind your results. See how to add profit and margin alongside sales so you can compare revenue and profitability in the same analysis. You can identify periods where margin is falling, move into customer-level detail, and sort the results to find the accounts contributing most to the change. From there, drill into the underlying transactions to identify low-margin or unprofitable sales and review the discounts or individual transactions behind them.
