Walk into the negotiation with receipts
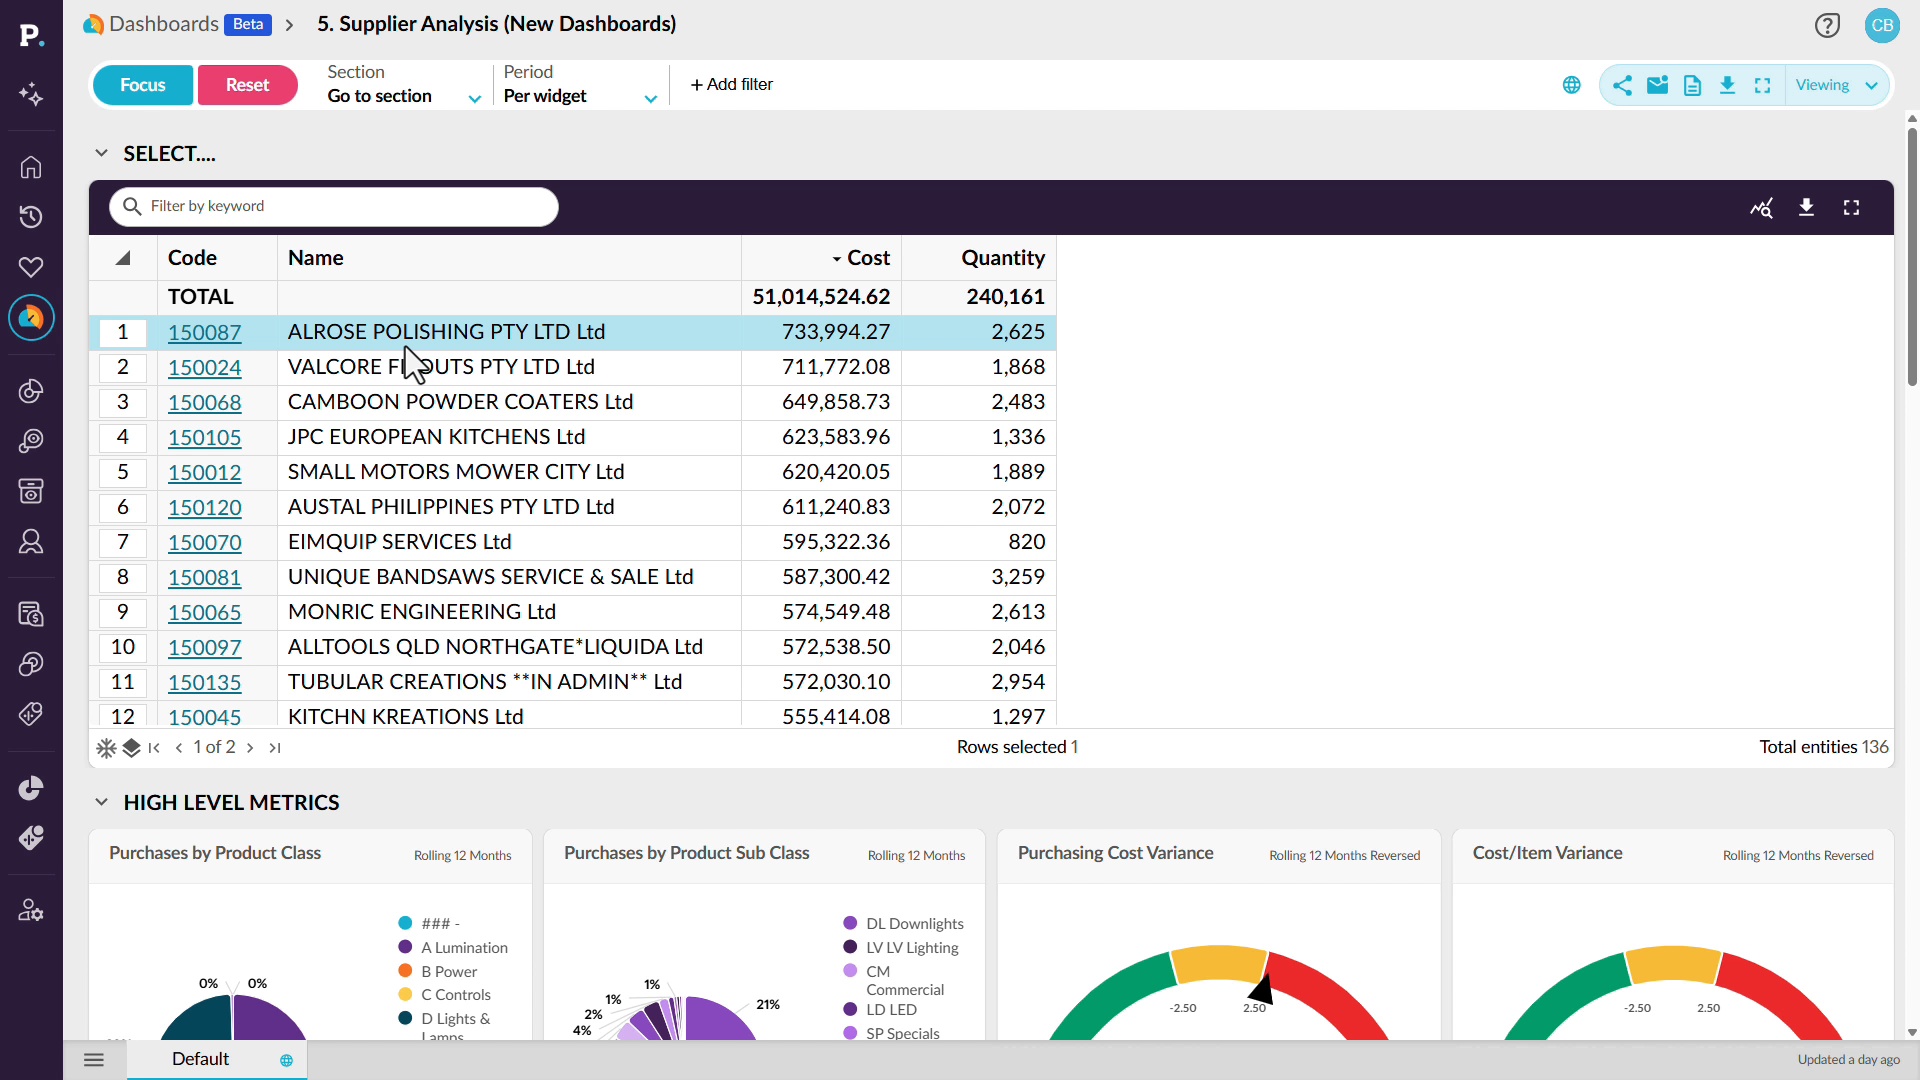
Prepare for supplier negotiations with a clear picture of purchasing activity, costs, and supplier performance. See how a supplier analysis dashboard brings together information such as purchasing costs, quantities, open purchase orders, average order values, and potential price changes. You can filter the dashboard for a particular supplier or product category to review the figures that matter to your discussion. From there, move into detailed analysis to investigate purchasing cost variances, compare trends over time, and drill down to individual purchase order transactions. This gives you the evidence to understand spending patterns, question price changes, and approach supplier conversations with data to support your decisions.
Supporting documentation
 Analytics

Related video tutorials
 Financial Statements
View and explore dashboards
 Platform
Use dashboards
 Analytics
See cross-sell gaps across every account
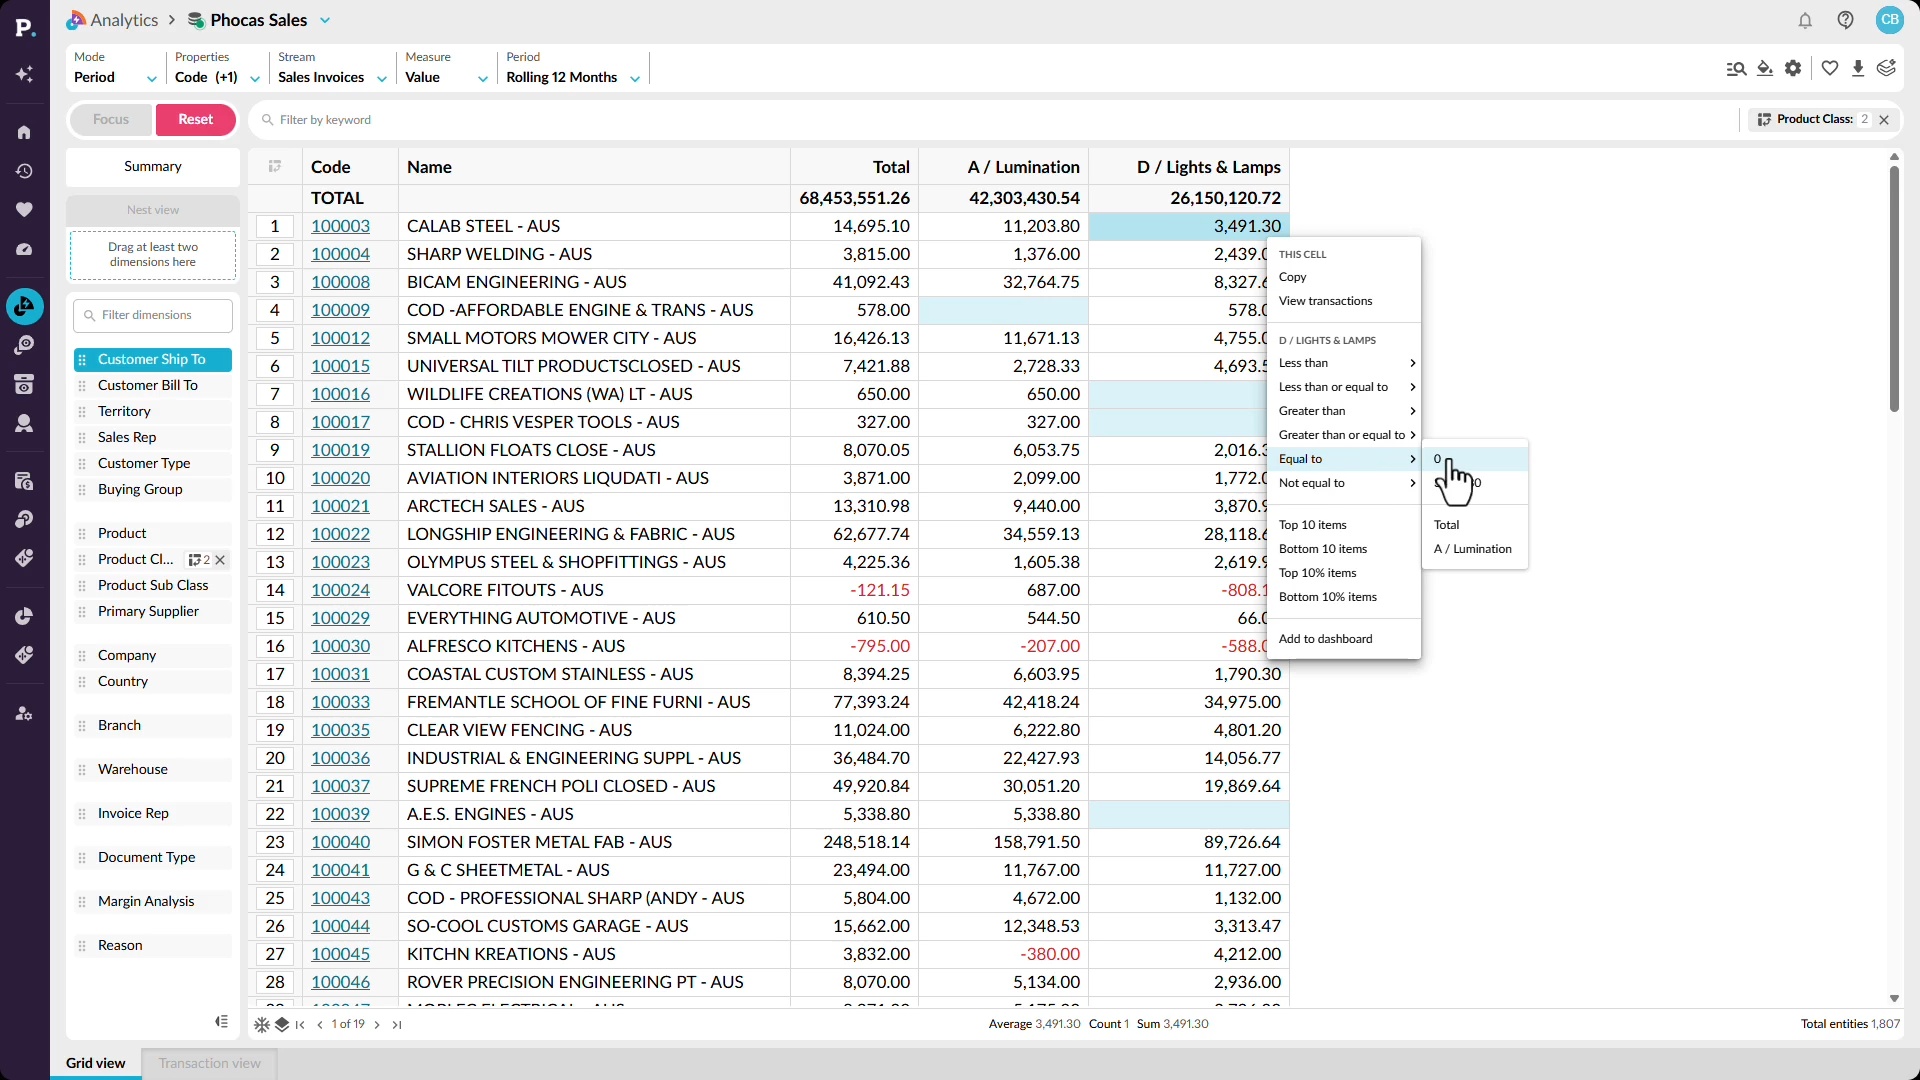
Find cross-sell opportunities by looking for gaps in what customers are buying. See how Workspaces can identify customers purchasing from one product category but not another and return a list of accounts that may have an opportunity. You can then explore the same pattern across your wider customer base and filter the data to focus on specific category combinations. This gives you a repeatable way to find accounts where related products or categories are missing from the current sales mix.
 Analytics
Catch an off-track rep in time
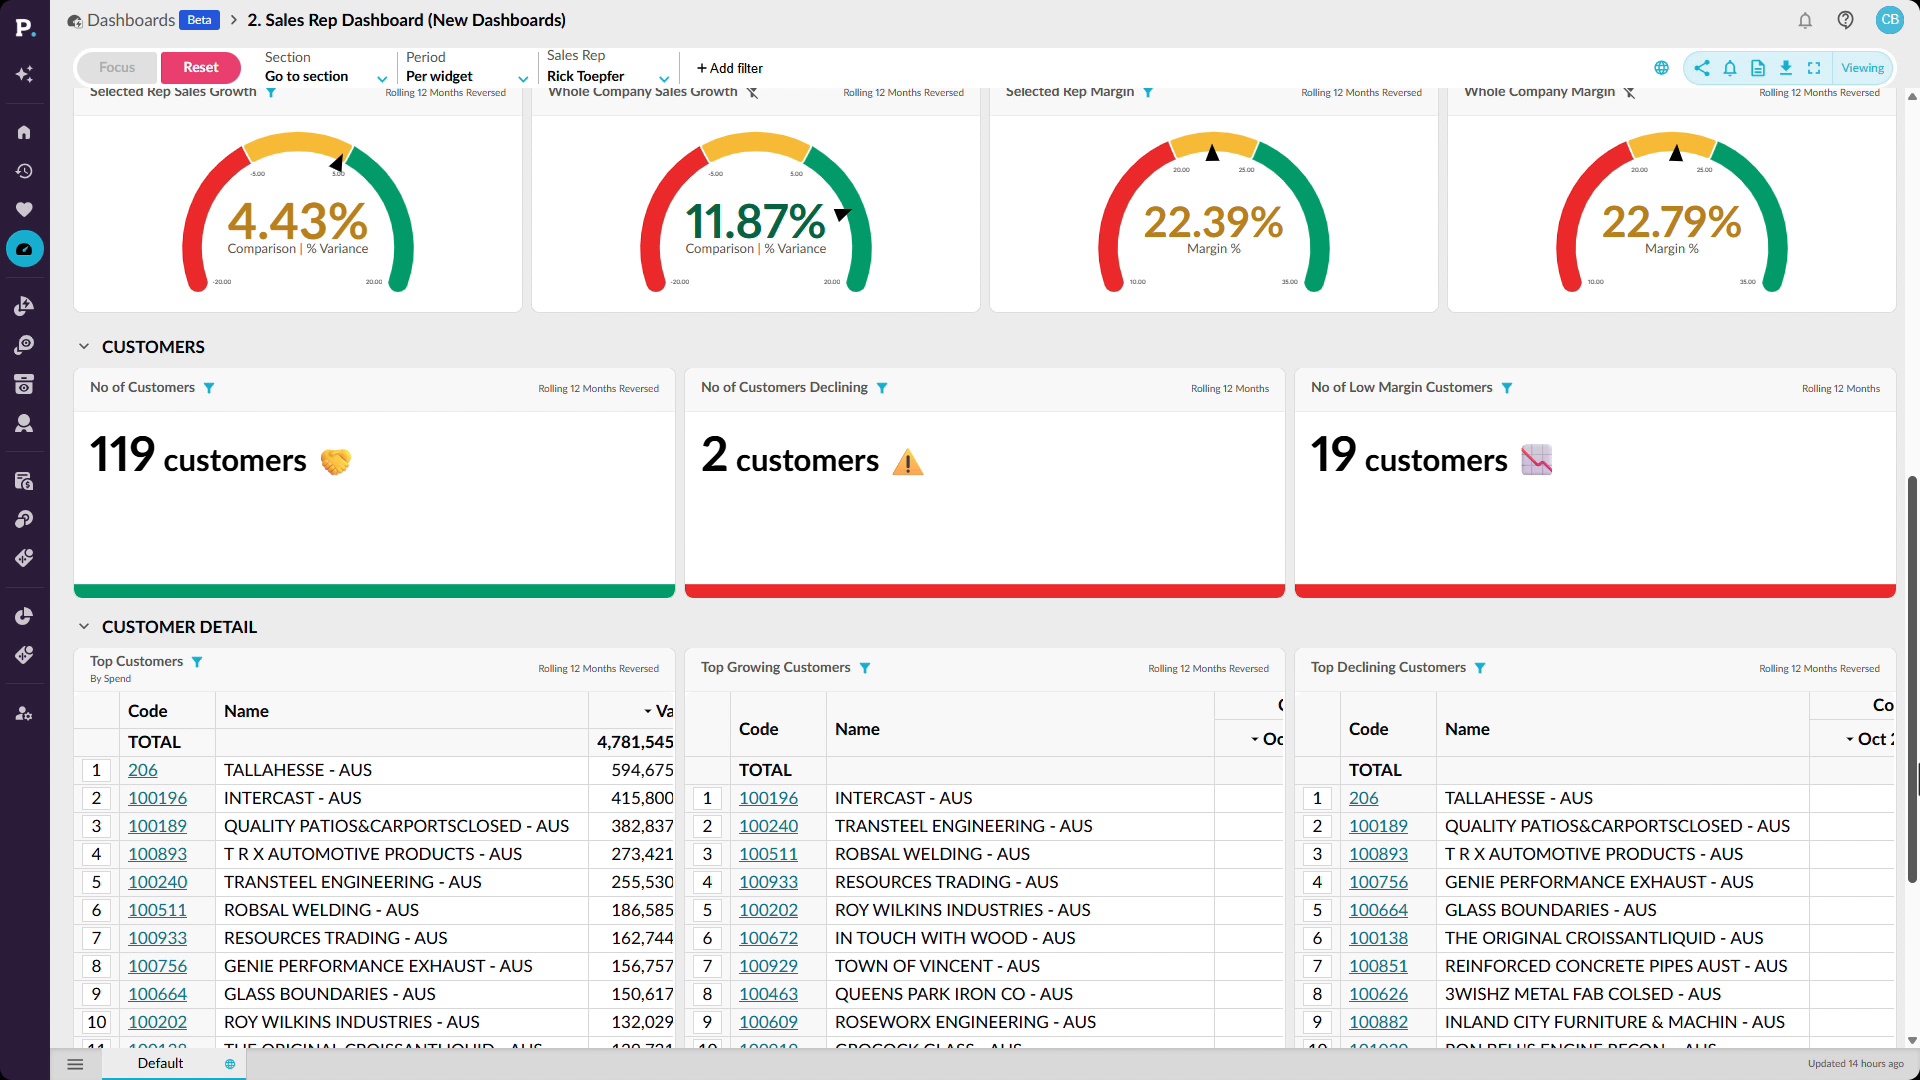
Use dashboards and detailed analysis to see how sales reps are performing against budget or quota. Start with a high-level view of performance, then filter the dashboard for an individual rep and change the reporting period to compare sales with budget year to date. From there, you can investigate where performance is falling behind and save, share, or add the results to a dashboard. This makes it easier to spot issues early and focus attention on the reps who may need support.
