Comparison of sales information against targets has many benefits such as allowing individuals to be more strategic, more motivated and more in control of their actions. This video contained in the Phocas online library shows you how to compare multiple data sources to see sales performance against budget and stretch budget.
The first step is to select the 'Rep' dimension and choose the stream mode. Once in stream mode, an additional menu or ‘Variance Stream’ tab will appear to the right of the stream. Stream and Variance control which data streams you'd like to see in your columns. By selecting ‘sales’ in Stream and ‘Budget’ in Variance Stream, you’ll see columns for stream, plus variance columns for percentage variance and percentage variance cumulative. The delta symbol indicates change or difference.
To compare multiple streams side by side, select an additional stream from the Variance Stream menu. In this example, we’ve selected ‘Stretch Budget.’ The variance columns display the difference between sales and budget and sales versus stretch budget. Now we can clearly see if our reps are meeting their targets. And changing the view to target percentage, we can now see that sales rep AG has hit 86% of his budget but only 52% of his stretch budget for this year.
You can also add variance information to your view. For instance, select ‘Sales-Previous’ from the Variance Stream menu to adds historical data. Now you can compare your current sales to your previous sales to your budget.
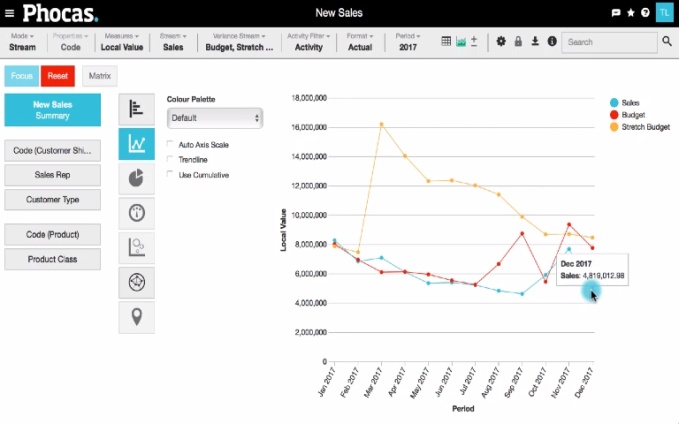
Presenting a summary as a line chart creates an easy-to-understand visualization of the data for meetings or presentations. Simply select the summary, then chart view and choose the ‘Line Chart” option. Now you have a graphical depiction of how your sales reps are tracking against targets for the year.
To better understand all the features of Phocas data analytics, book a demo today.


Empowering businesses with intuitive data analytics, driving informed decisions for growth and profitability. We make people feel good about data.
Related blog posts


Browse by category

Find out how our platform gives you the visibility you need to get more done.
Get your demo today