Customized financial reports for quick analysis
Quick, obligation free

See how Phocas streamlines financial reporting - 1:17s
See your financial health at a glance
Speed up month-end close with accurate, consolidated data for your financial statements.
- Create income statement, balance sheet and cashflow statements for all divisions in a few clicks
- Take advantage of formulas and custom metrics for margins and KPIs to display in reporting
- Statements update automatically with the latest data
- Empower the whole business with relevant financial information, customized for their needs instantly

Empower your finance team
"This is a very user-friendly product. We can build it and compare numbers month over month, or year over year. And it's very helpful to build in some of those gross margin and some of those analyticals into the financial package that we use at month end as well as every day."
Amanda Ware
Director of Accounting and HR at Stokes Electric Company

Financial Statements in action: Take a video tour
-

Automate month-end
Speed up month-end close by 50%. See how Phocas automatically structures your data into up-to-date financial statements, saving you hours of number-crunching. -

Customize statements
Phocas makes customization a breeze. Learn how users can easily tailor statement views to suit specific needs without the hassle of spreadsheets. -

Track performance
With Phocas, dynamic, interactive statements and dashboards allow you to track performance at any time and to freely investigate your financials. -

Financial ratios
Phocas simplifies the process of creating and tracking essential financial ratios. In this video, learn how to build custom ratios, like revenue per customer, to keep your business on top of its key performance metrics. -

Spot opportunities & risks
With Phocas, you can easily check for errors, spot potential risks and uncover the root causes very quickly by drilling down to the transactional data. -

Management reporting
Phocas makes it easy to create tailored, up-to-date management reports and board-level dashboards. Customize views for each department, and share insights effortlessly, all from one platform. -

Visual storytelling
See how Phocas brings performance metrics to life with dashboards and charts, making it easier for non-financial team members to engage with their numbers. -

Financial consolidation
Phocas makes it easy to report across multiple currencies and subsidiaries in your Profit and Loss, balance sheet and cashflow statements.
More insight into your business performance
Measure and analyze individual or group performance across periods (MoM, YoY), statements and key metrics.
- See underperforming areas by tracking live actuals against budgets
- Analyze revenue and expenses with side-by-side comparisons
- Filter analysis for group, subsidiary, branch, brand or product views
- Create and track specific business-related ratios by pairing operational and financial data

Customer quote
Phocas can manage a lot of data, so in seconds, I have up-to-date financial reports.
Epicor + Phocas customer
Find the outliers in your financials quickly
Answer questions on the spot by drilling down to the connected transactional data.
- Understand what's changing and why with variance analysis
- Have more time to analyze cashflow or operations
-
Built-in data checks ensures accurate ongoing updates
-
Share information and ideas across different parts of your business

Customer quote
Instead of 183 per company x 110 companies ledger lines to compare growth, industry, branches over a period in time, now it is drag and drop. With the big picture visualized the buy-in is 'common sense'.
Klipboard + Phocas customer
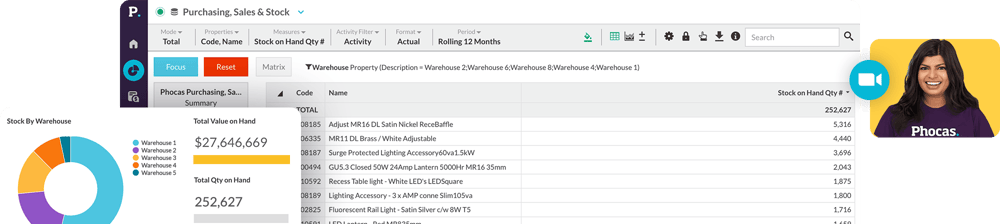
Management reports to suit your business
No more complex data manipulation to get daily visibility into key operating KPIs.
- Customize reports for branches, divisions, board with various reporting levels
- Control security access without touching the general ledger
- Provide teams with self-serve dashboards for ad hoc review from anywhere
- See real-time performance across all your KPIs

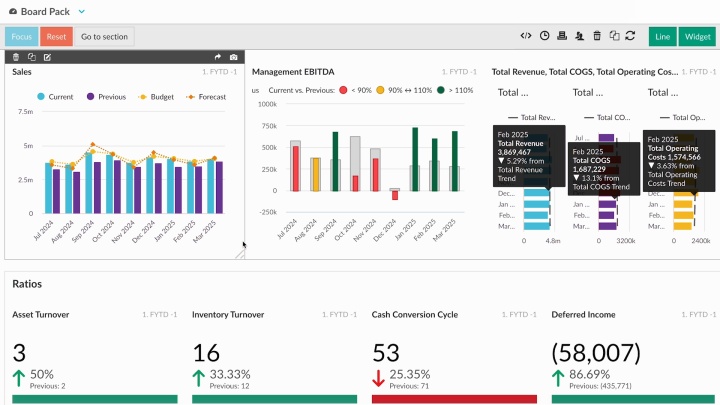
Interactive visualizations
Make interpreting numbers easier so you can act faster.
- Build, customize and share dashboards for a clear business overview
- Understand the impact of financial ratios and KPIs on performance
- Switch from visualization to underlying data across all metrics
- Impactful charts and graph options make performance easier to understand
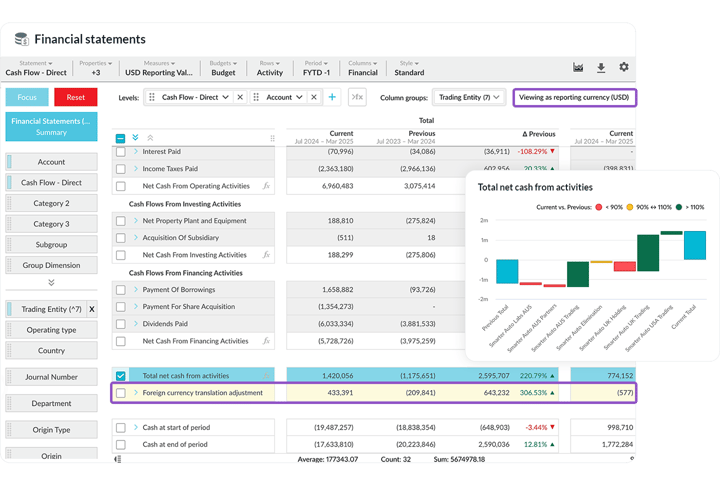
Automate financial consolidation
Switch between a consolidated view or specific subsidiaries, territories, or branches as required.
- Automatic data integration from your entities or departments into a central database
- Generate consolidated balance sheets, income statements, and statements of cash flows
- Toggle between local currency and reporting currency
- Automatically calculate currency gains or losses from foreign subsidiaries in the balance sheet and cash flow
- Transform complex, manual multi-entity consolidation into a seamless process with intuitive intercompany journal eliminations
Customer quote
Phocas supports cross-functional departments. It’s cloud-based and can easily compare multiple groups of data.
Infor + Phocas customer


See how Phocas stacks up
Anaplan vs Phocas
Board vs Phocas
Prophix vs Phocas
Vena vs Phocas
Jedox vs Phocas
Planful vs Phocas
Workday vs Phocas
OneStream vs Phocas
Pigment vs Phocas
We think you’ll love Phocas, but don’t take our word for it


Understand the past, operate better today, and plan well for the future