Finance use cases
This module shows how finance teams use Analytics to chase receivables, understand margin, and prepare for reviews. Each video works through a real scenario, from aging analysis to dashboards.
 Analytics
5 videos in this learning module
Chase the numbers down yourself
Find where the value really is
See the whole business, not a slice
Stop waiting on an answer
Walk in already briefed
5 videos in this learning module
Chase the numbers down yourself
Find where the value really is
See the whole business, not a slice
Stop waiting on an answer
Walk in already briefed
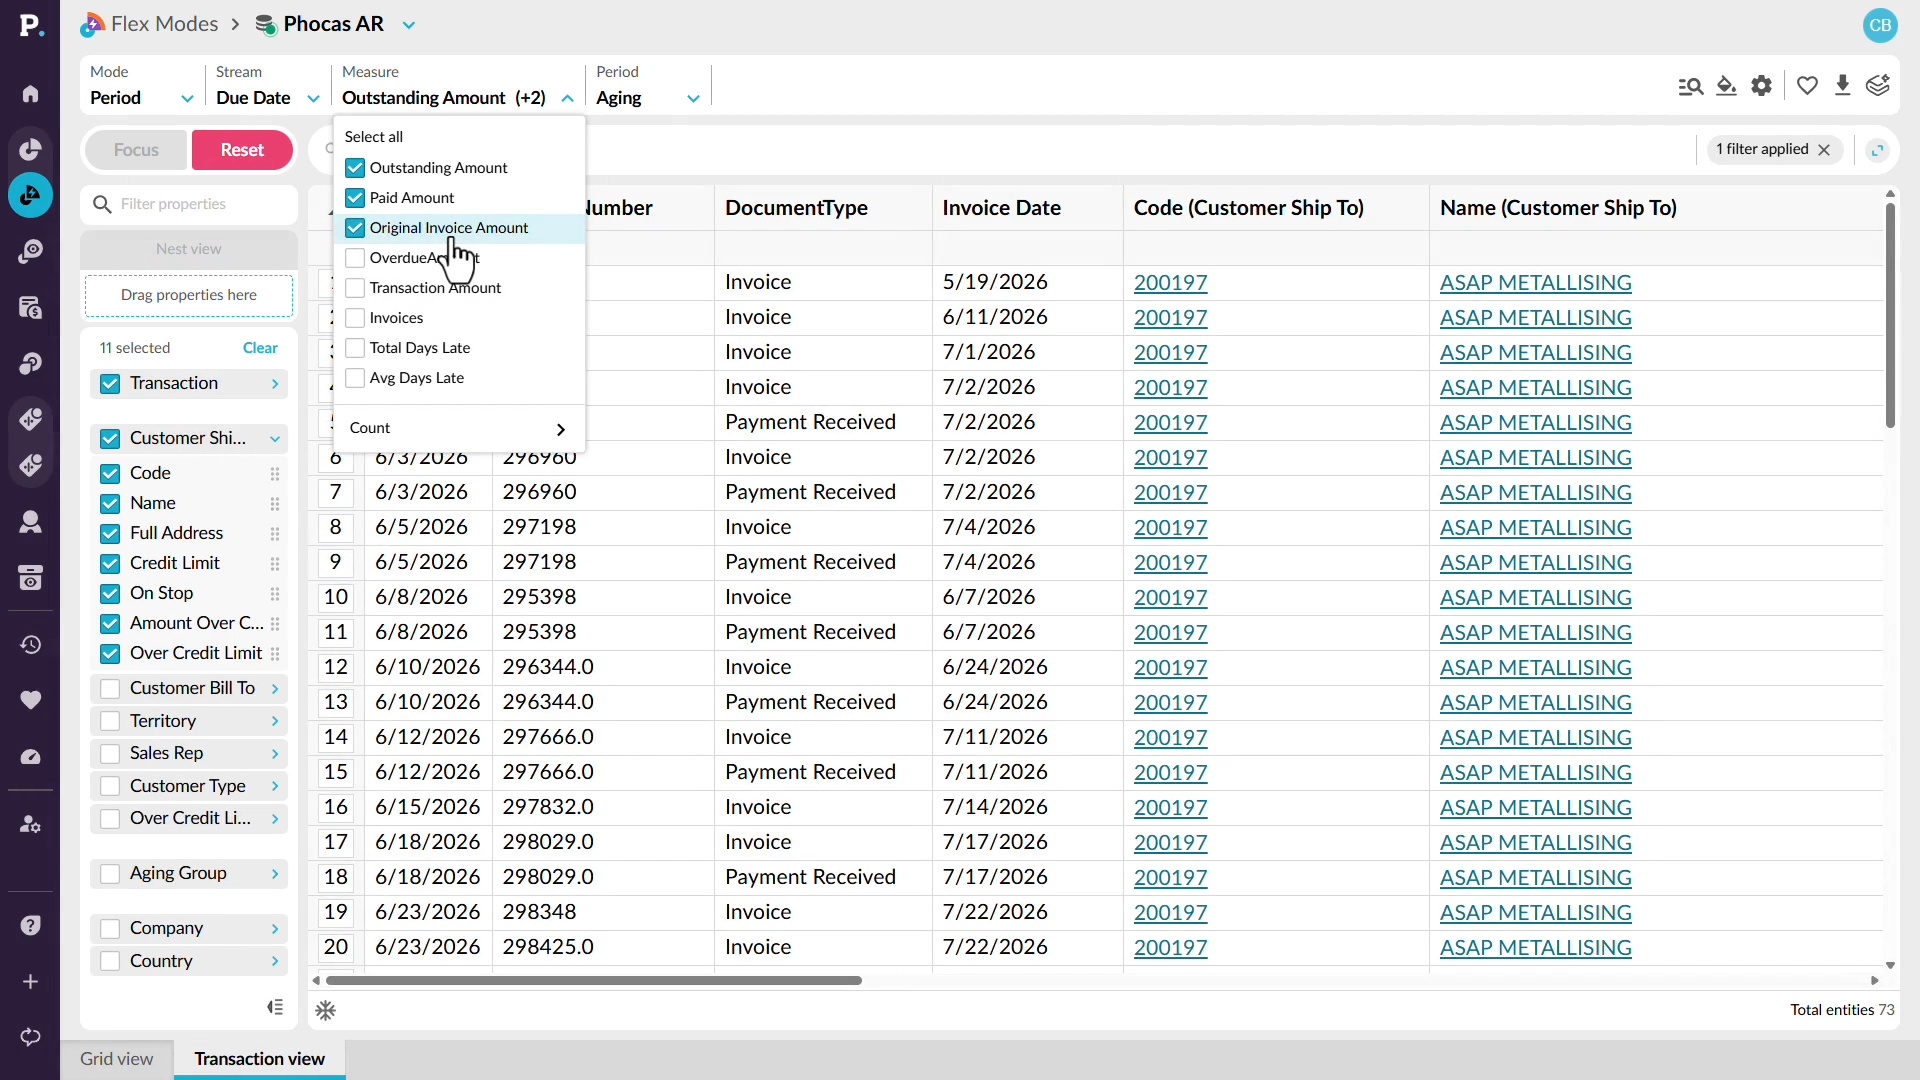
Chase the numbers down yourself
Investigate outstanding receivables without relying on another team to find the detail for you. See how to switch to an aging view, identify customers with the highest outstanding balances, and move from summary figures into the transactions behind them. You can then focus on a specific customer and review outstanding invoices alongside information such as credit limits, payments, and original invoice amounts. This gives you the context you need to understand what is contributing to the balance and follow it through to the underlying detail.
Supporting documentation
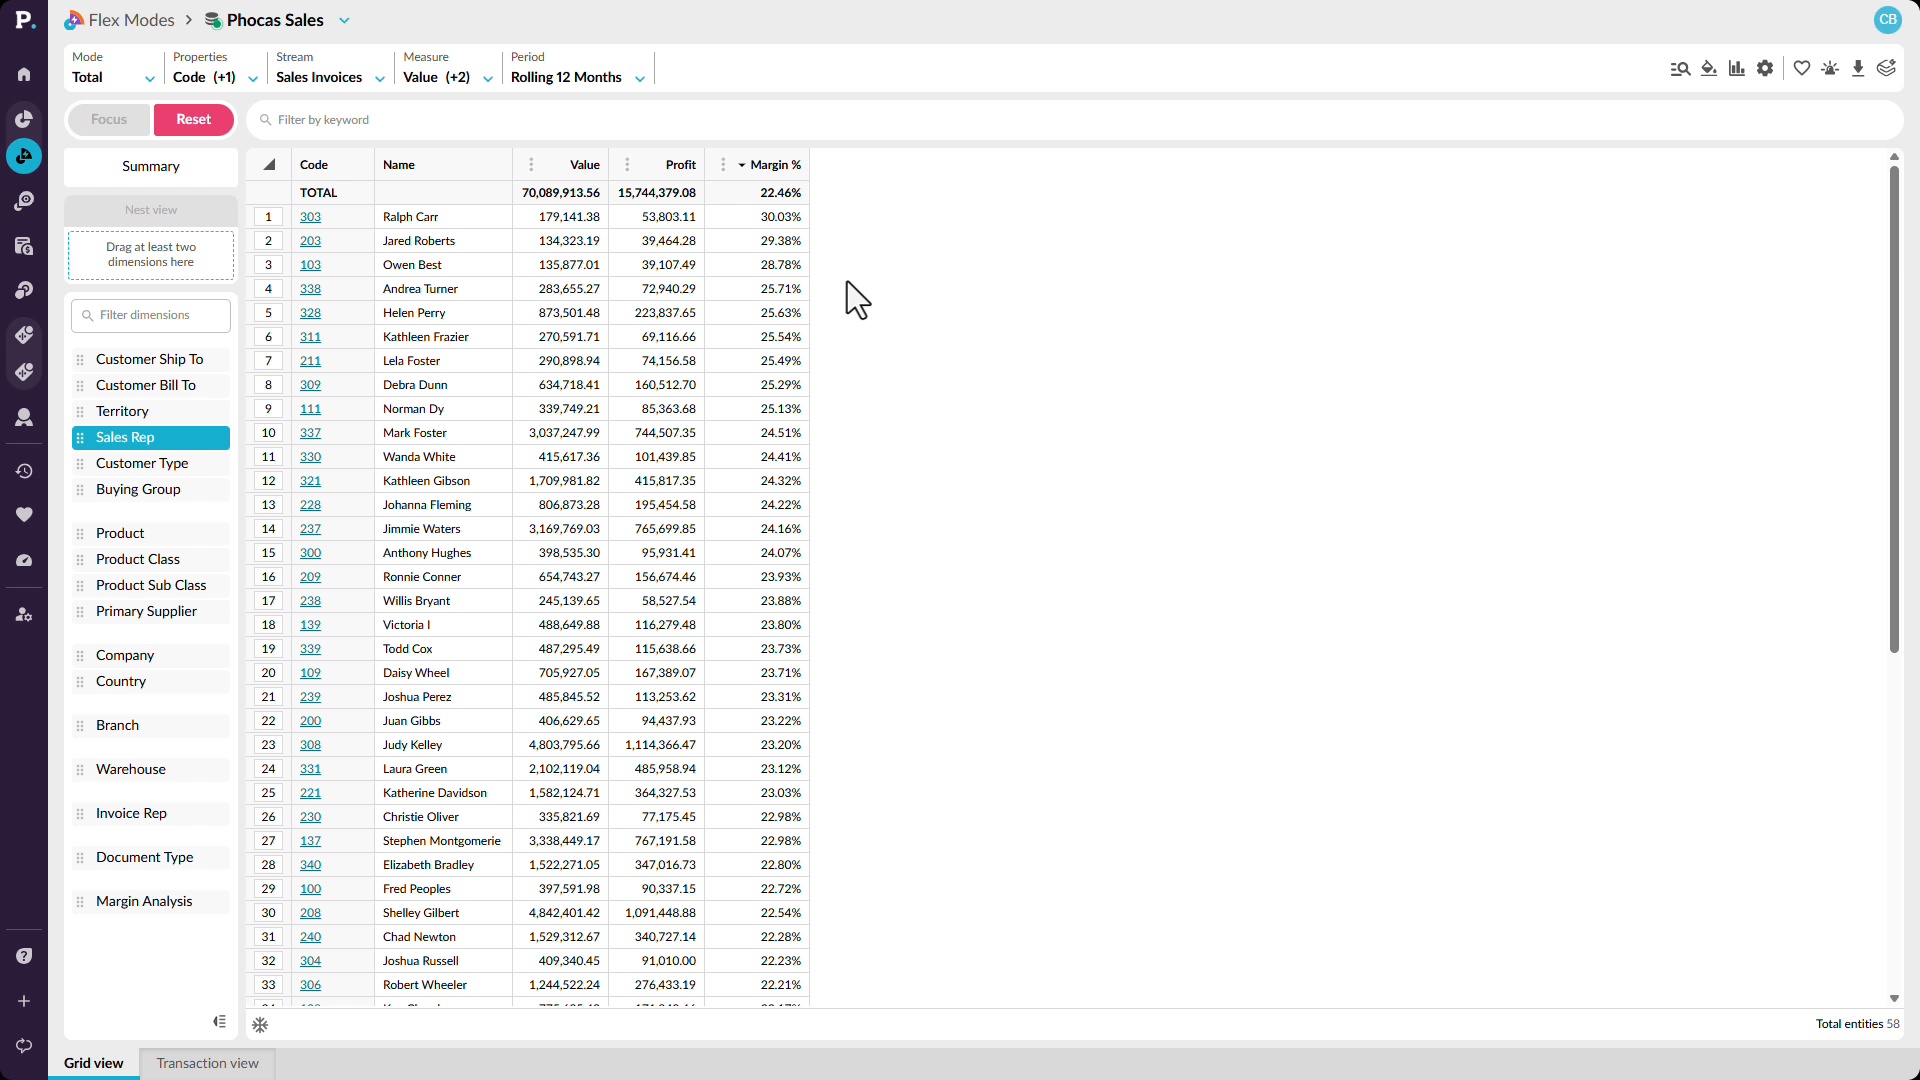
Find where the value really is
Look beyond revenue to understand which customers, sales reps, products, or locations are actually contributing the most value. See how to add profit and margin percentage alongside sales, identify changes in margin over time, and break the results down by sales rep. You can compare high-revenue performers with those delivering stronger margins, then focus on a particular rep and continue drilling into product categories and individual products. This helps reveal where strong sales are also profitable, and where apparently good performance may be hiding weaker margins.
Supporting documentation
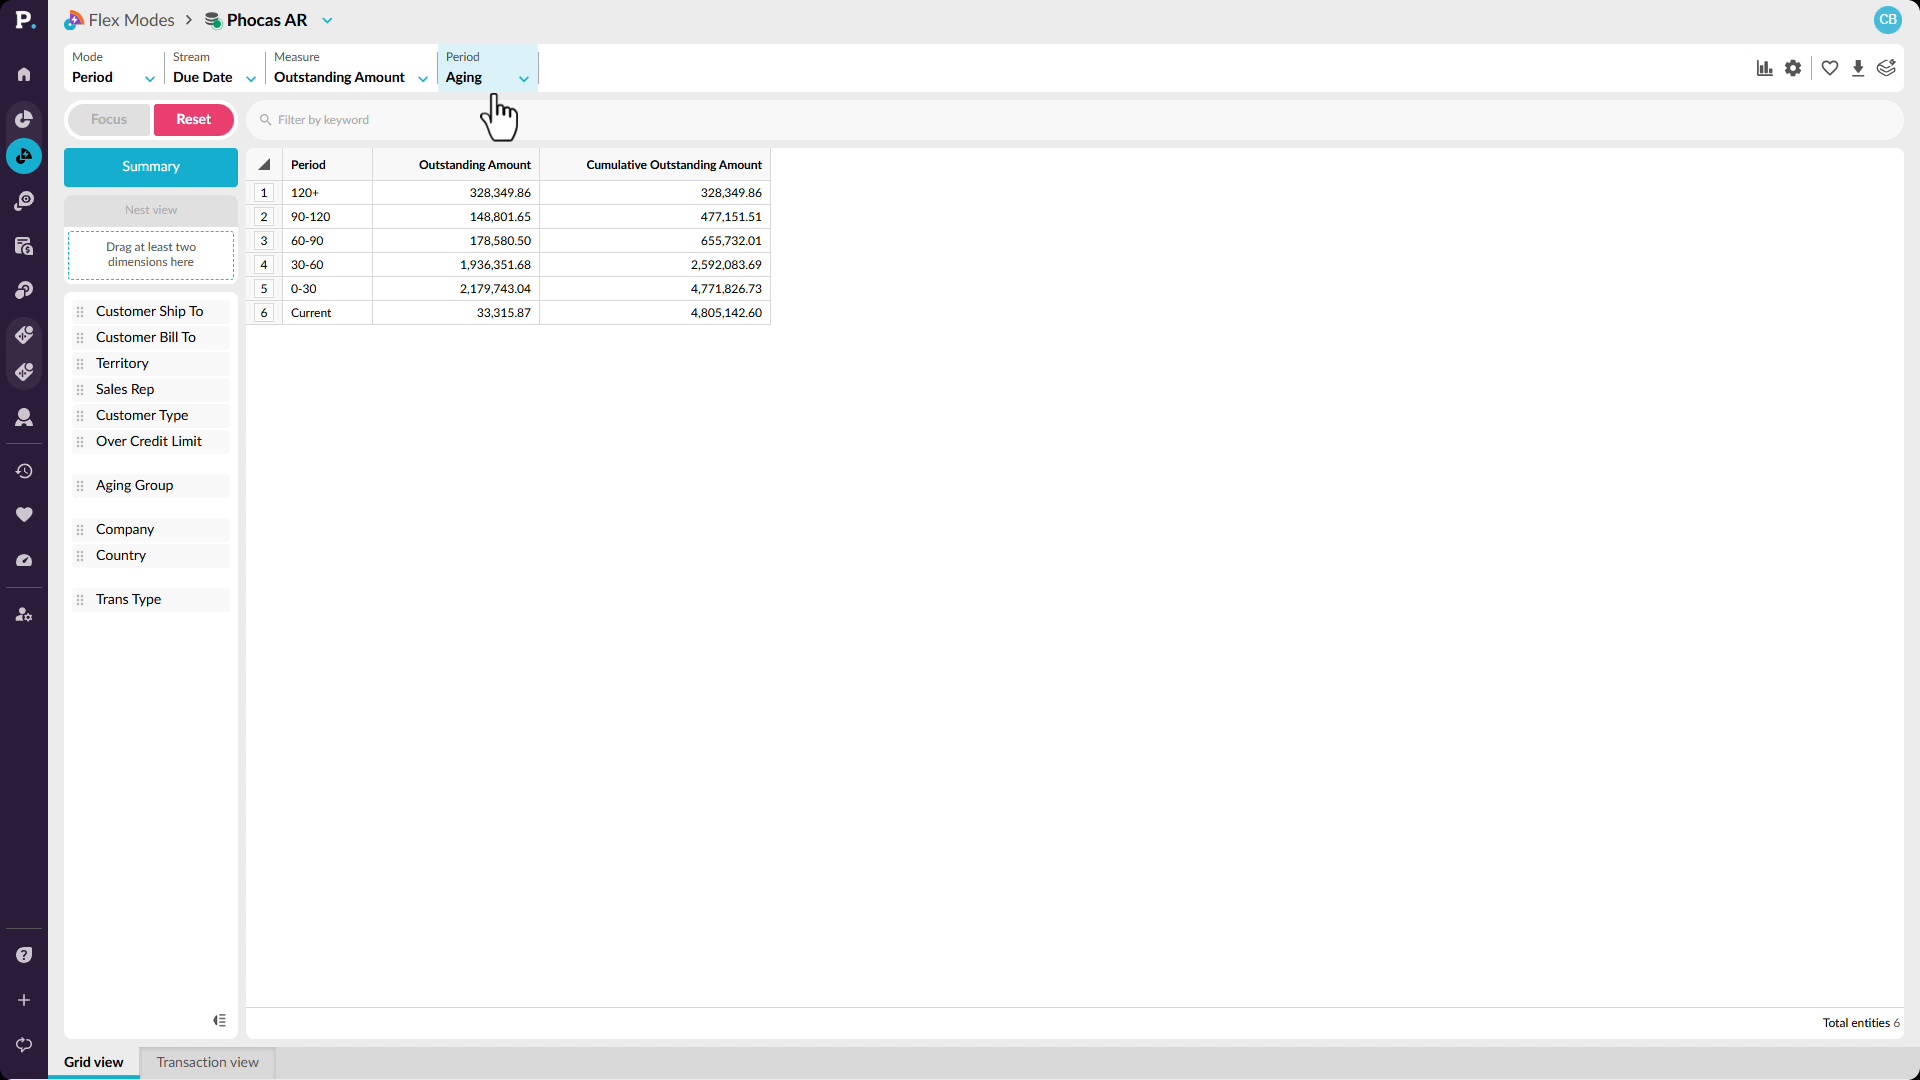
See the whole business, not a slice
See receivables across the wider business and quickly narrow in on the areas that need attention. Start with an aging view that brings outstanding amounts from across entities, branches, product lines, and customers into one analysis. You’ll see how to switch the view to compare trading entities, focus on a specific aging bucket, and then move down to the customers contributing to that balance. By filtering for overdue amounts, you can identify accounts receivable risk earlier and understand where it sits before it reaches your financial reporting.
Supporting documentation
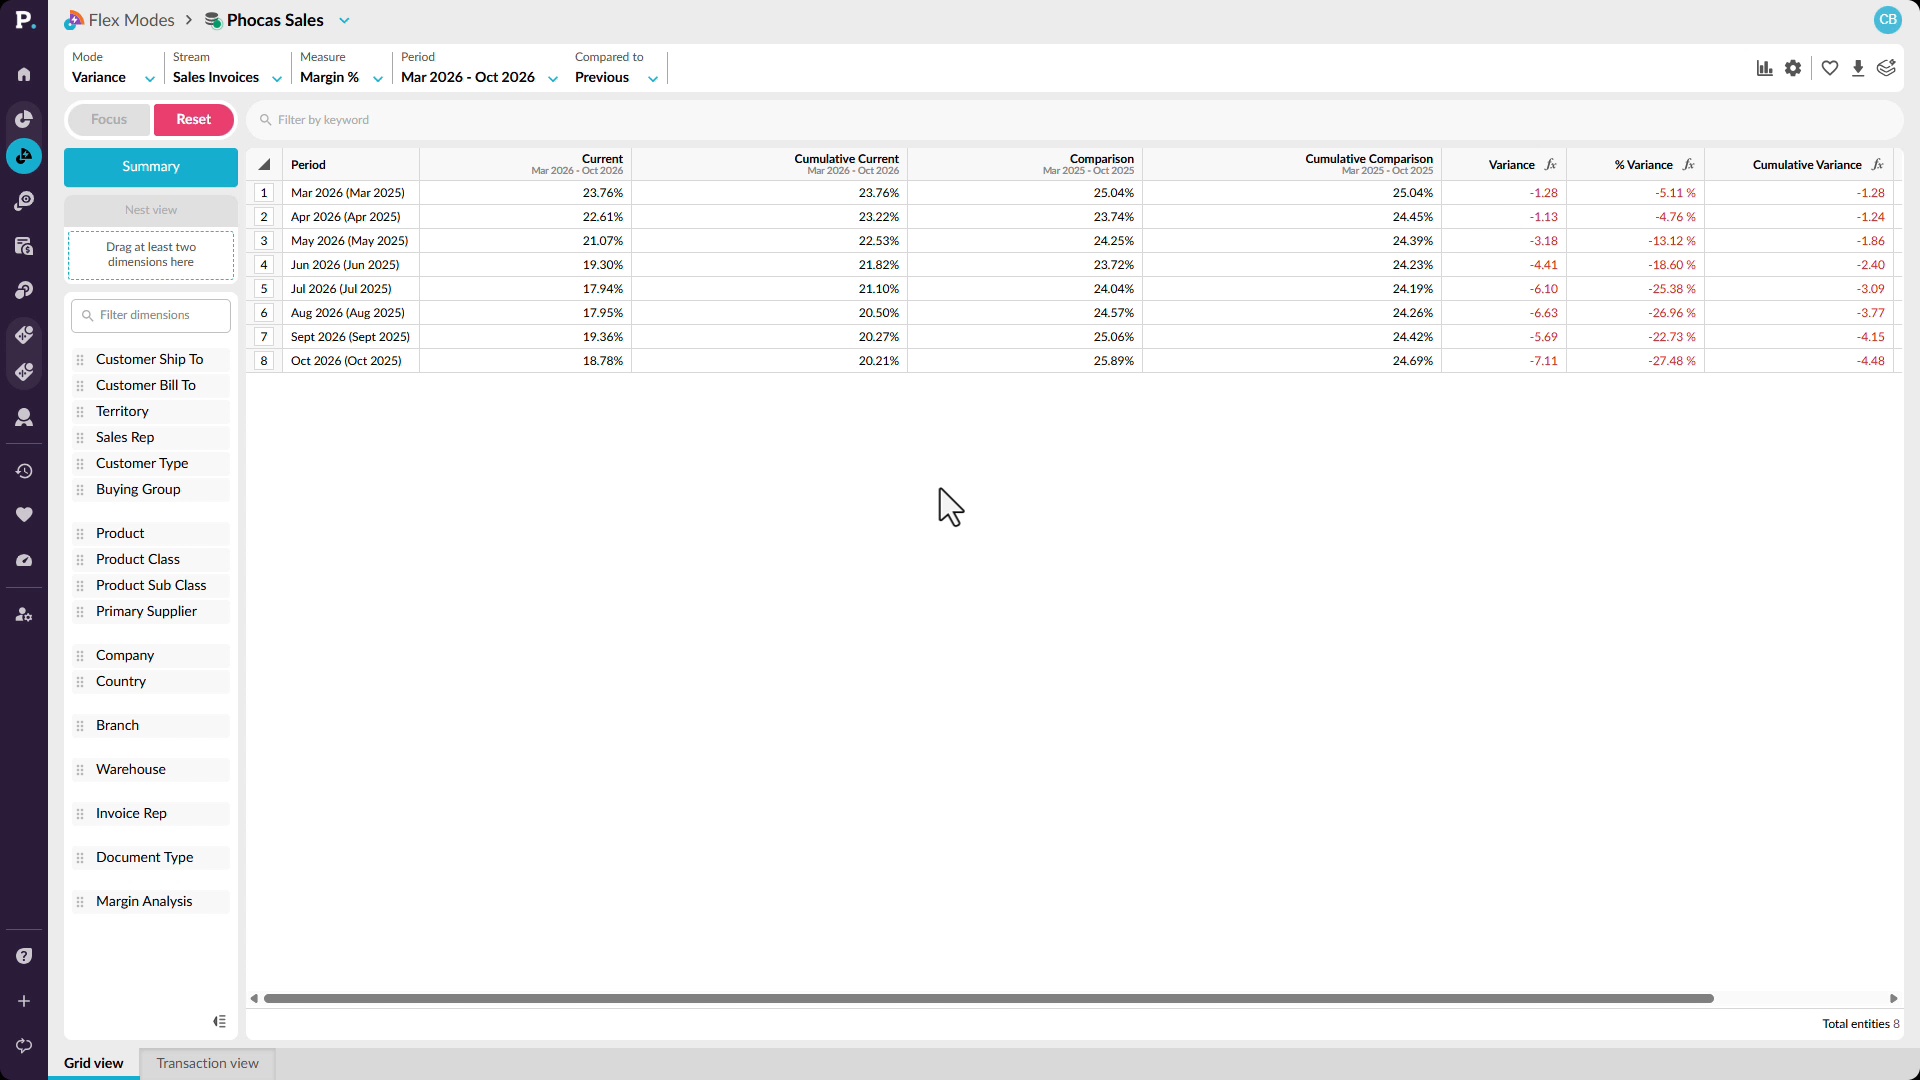
Stop waiting on an answer
Trace a change in margin from the overall trend down to the customers and transactions behind it. Start by comparing margin percentage across rolling 12-month periods, then narrow the analysis to the months where performance has declined. From there, see how to identify customers contributing to the negative variance and move into transaction-level detail. You can bring in additional information such as salespeople, products, and product classes to keep investigating the cause, helping you answer questions about a margin anomaly without waiting for a separate report.
Supporting documentation
Walk in already briefed
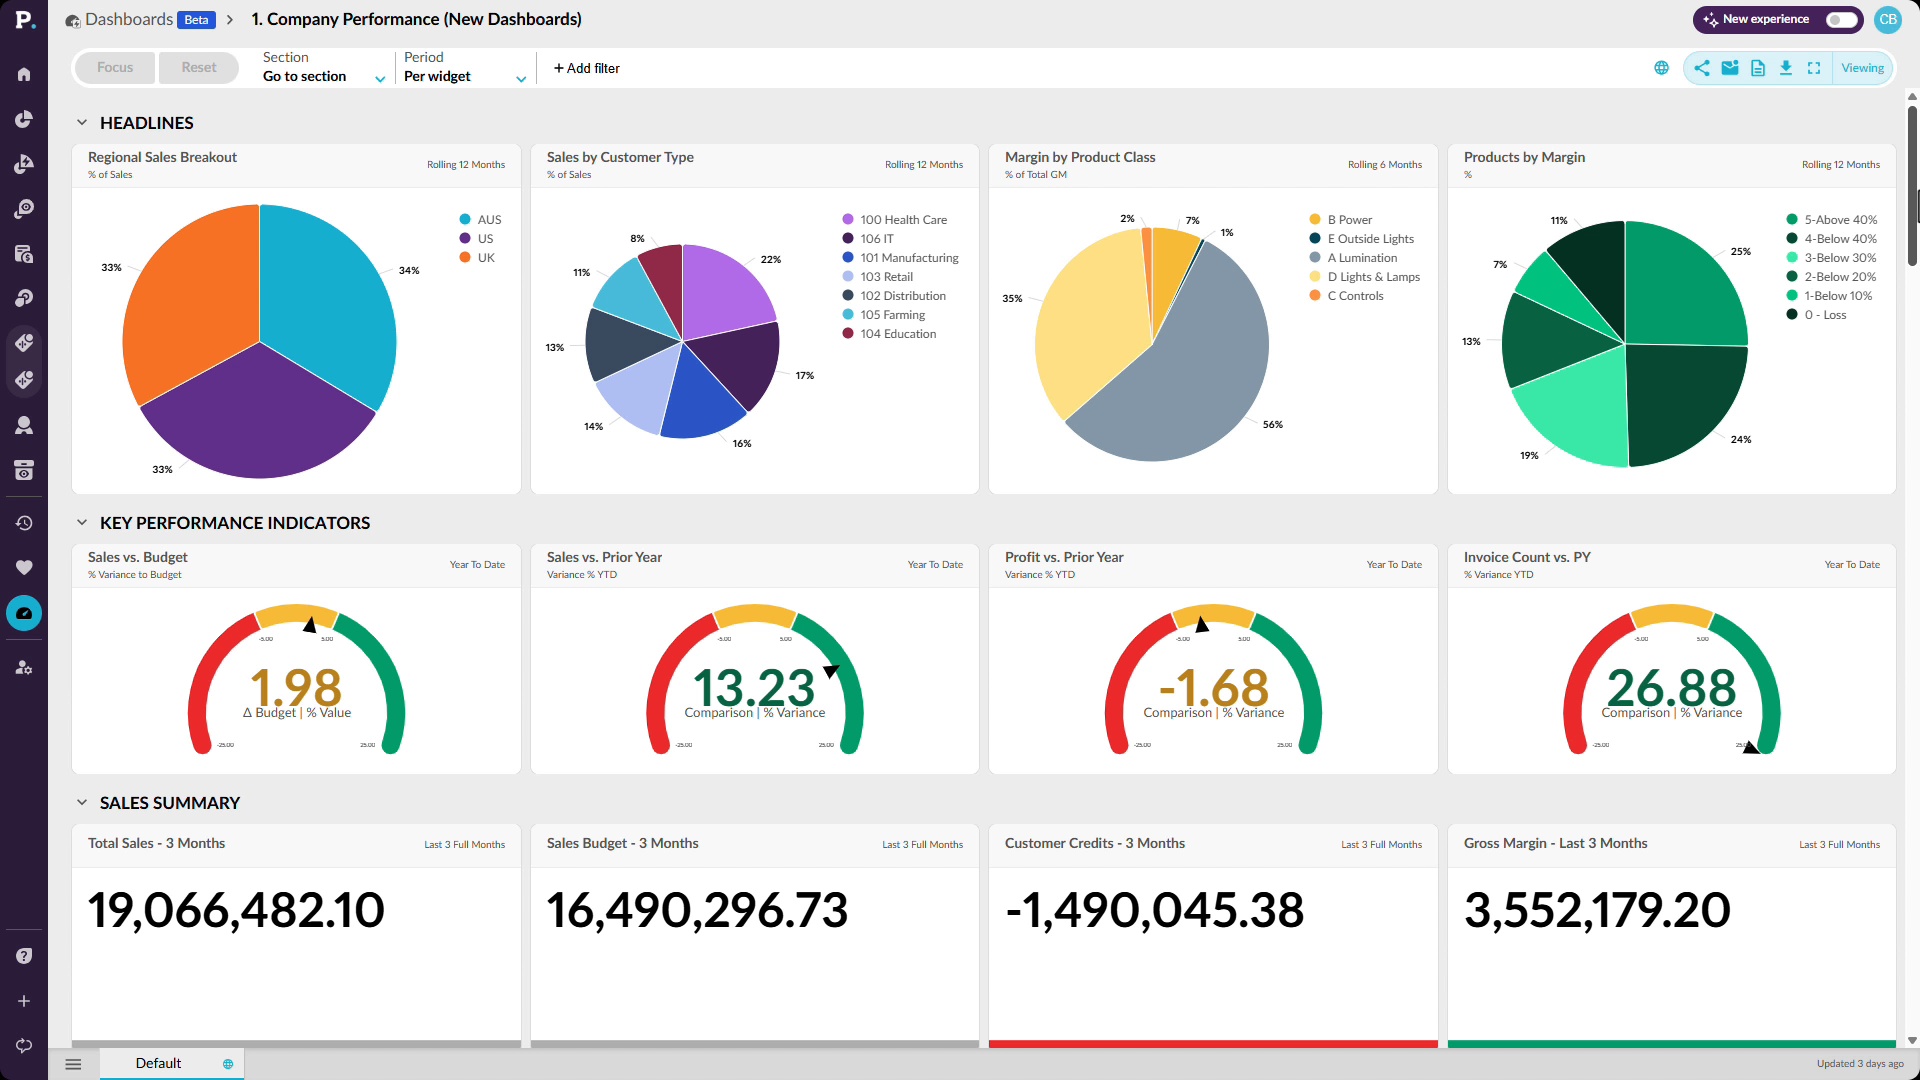
Get ready for reviews without spending hours chasing numbers, waiting on reports, or piecing information together. See how a dashboard brings KPIs from across the business into one place, including sales to budget, profitability, customer credits, quote conversion, rep performance, inventory, and finance. You’ll also see how to focus the entire dashboard on a region, add filters such as product class, and drill into the data behind a result when something needs more attention. This gives you a faster way to answer your own questions and walk into a meeting with the detail already at hand.
Supporting documentation
Analytics 
Related learning modules
 Analytics
Get started with Analytics
This beginner-friendly module walks you through getting started in Analytics and shows you how to run simple analyses for quick insights. Learn how to explore your data and see how the different modes and features give you the flexibility to view, compare, and analyze your information in ways that work best for you.
 Analytics
Use Analytics
 Analytics
Sales use cases
This module shows how sales teams use Analytics and Workspaces to track rep performance, spot churn risk and cross-sell gaps, and understand margin. Each video works through a real scenario.
 Analytics
Operations use cases
This module shows how operations teams use Analytics to manage inventory and supply. Each video works through a real scenario, including weeks of cover, stock variances, on-time in-full delivery, dead stock, and supplier negotiations.
