Get started with Flex Modes
This beginner-friendly module walks you through getting started in Flex Modes and shows you how to run simple analyses for quick insights. Learn how to explore your data with Flex Modes and see how the different modes and features give you the flexibility to view, compare, and analyze your information in ways that work best for you.
 Flex Modes
 6 videos in this learning module
Take a tour of Flex Modes
Work with the grid
Manage grid settings
Filter data (Flex Modes)
Change the period (Flex Modes)
Switch modes
6 videos in this learning module
Take a tour of Flex Modes
Work with the grid
Manage grid settings
Filter data (Flex Modes)
Change the period (Flex Modes)
Switch modes
Take a tour of Flex Modes
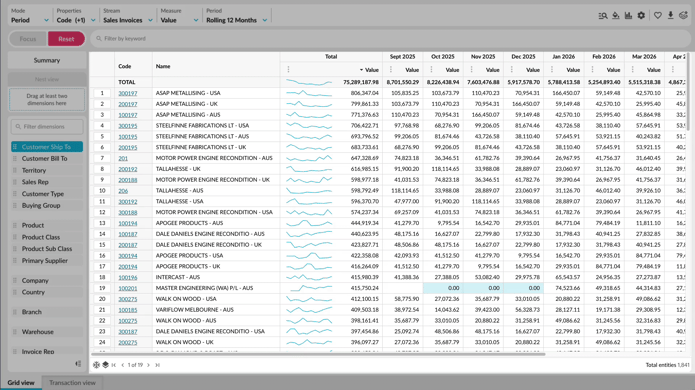
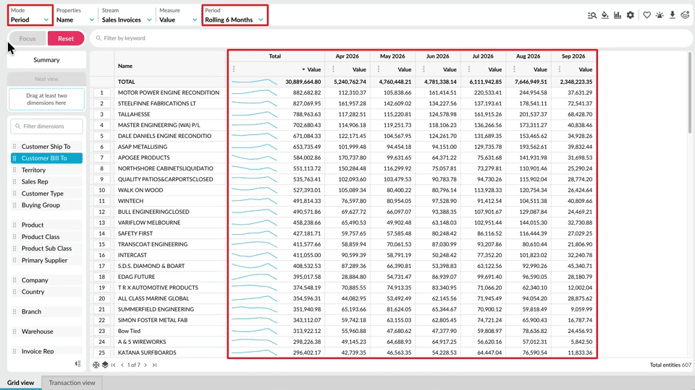
Learn how to explore your data with Flex Modes, and see how the different modes and features give you greater flexibility in how you view, compare, and analyze your information.
Supporting documentation
Work with the grid
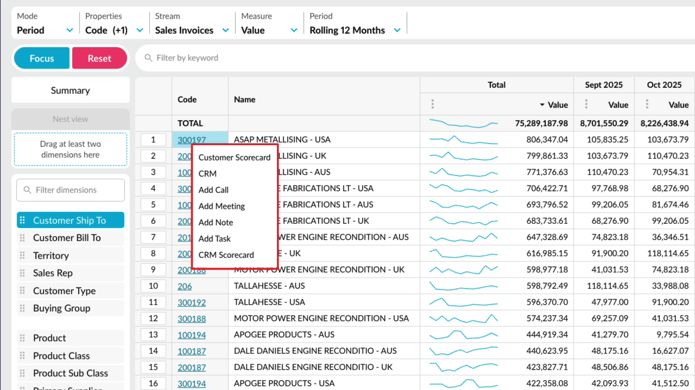
Learn how to work efficiently with the grid. This tutorial shows you how to sort data, freeze properties, navigate larger result sets, use grid actions and shortcuts, and quickly calculate values from selected data.
Supporting documentation
Manage grid settings
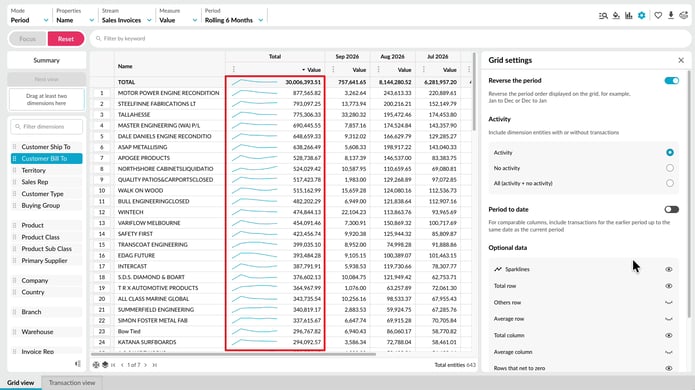
Learn how Grid settings help you control what appears in the grid and how your data is presented. Adjust the period order, include or exclude items based on activity, and refine date-related settings to focus the grid on the results that are most relevant to your analysis.
Supporting documentation
Filter data (Flex Modes)
Supporting documentation
Change the period (Flex Modes)
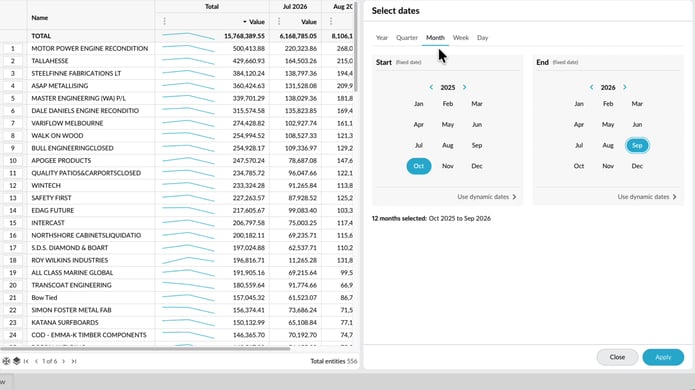
Learn how to change the period of your analysis so you can focus on the time frame that matters. See how to select from available periods, create fixed date ranges for specific reporting needs, and use dynamic user-defined periods that update automatically as time moves forward. This helps you compare and review data across the right dates without having to recreate your period settings each time.
Supporting documentation
Switch modes
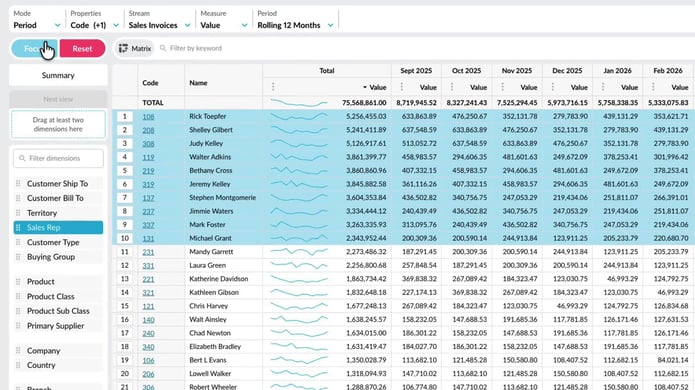
Learn how to switch between modes and views to analyze your data in different ways. See how Period, Variance, Stream, Total, and Transaction modes change what appears in the grid, and how Summary and Dimension views help you move between an overall result and more detailed analysis. You’ll also see how selections and filters can carry across supported views, so you can compare the same data from different perspectives without rebuilding your setup.
Supporting documentation
Flex Modes 
Related learning modules
 Flex Modes