Operations use cases
This module shows how operations teams use Analytics to manage inventory and supply. Each video works through a real scenario, including weeks of cover, stock variances, on-time in-full delivery, dead stock, and supplier negotiations.
 Analytics
5 videos in this learning module
Know your weeks of cover
Explain the variance, don't just log it
Make OTIF a number you manage
Walk into the negotiation with receipts
Stop losing stock to silence
5 videos in this learning module
Know your weeks of cover
Explain the variance, don't just log it
Make OTIF a number you manage
Walk into the negotiation with receipts
Stop losing stock to silence
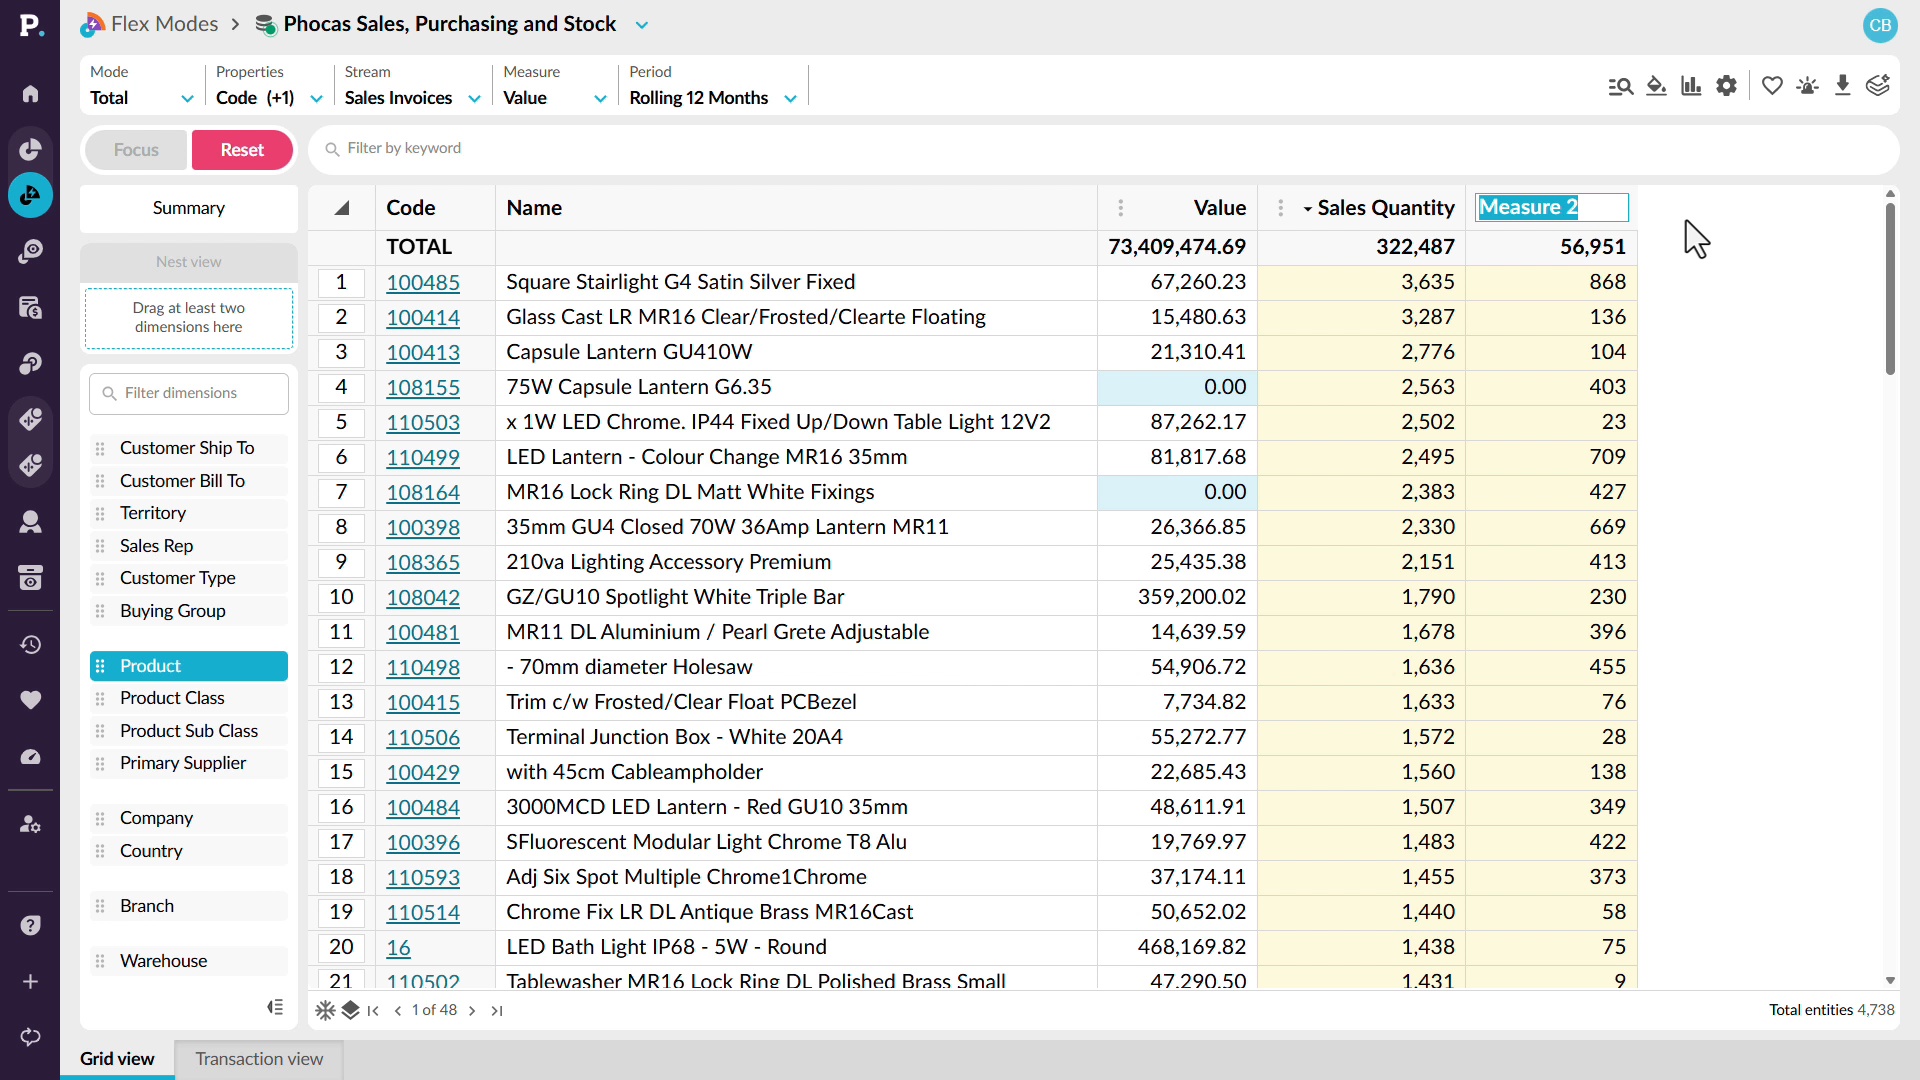
Know your weeks of cover
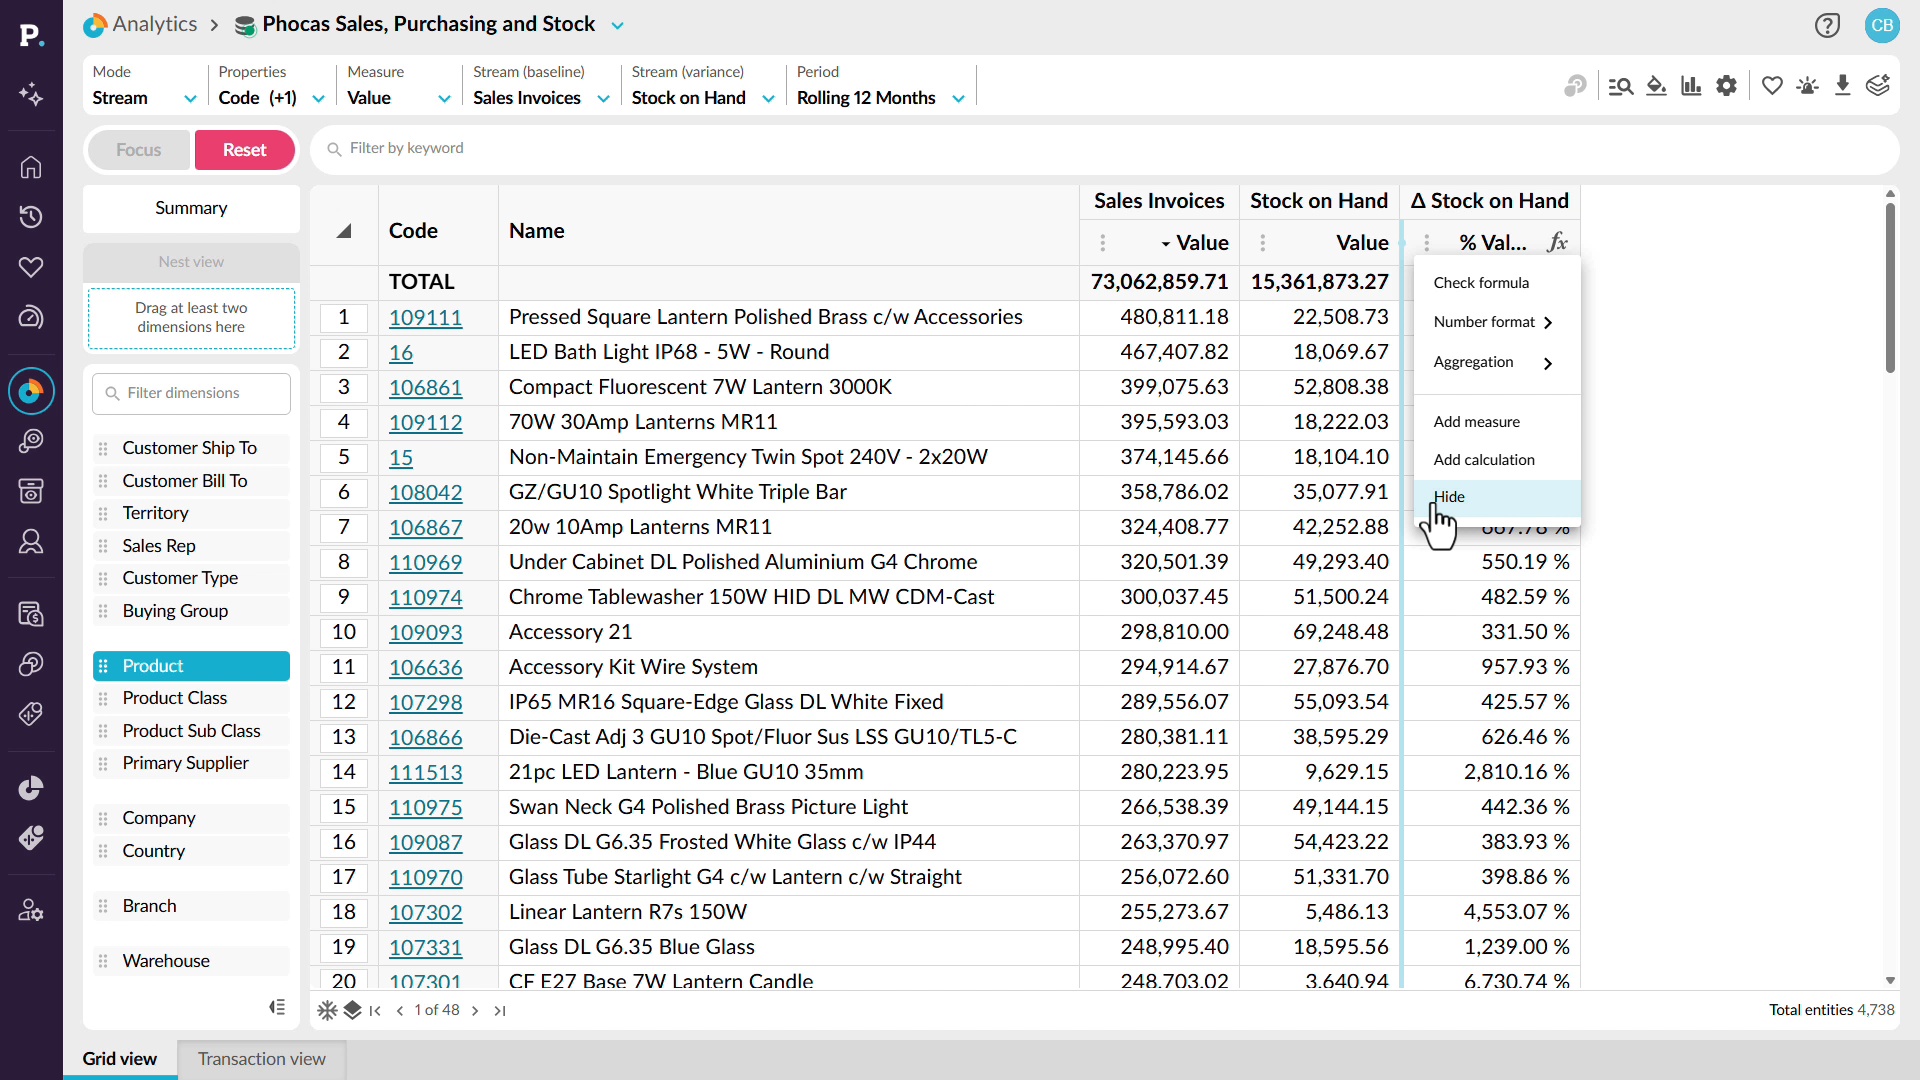
Bring sales, purchasing, and stock information together to get a clearer view of your inventory position. See how to add measures such as sales quantity and stock on hand, then use those values to create calculations directly in the grid. You’ll also see how to build measures such as weeks of cover and stock turnover, and adapt the calculations for different reporting periods. Because the results use the data already in your analysis, they update as new ERP data becomes available.
Supporting documentation
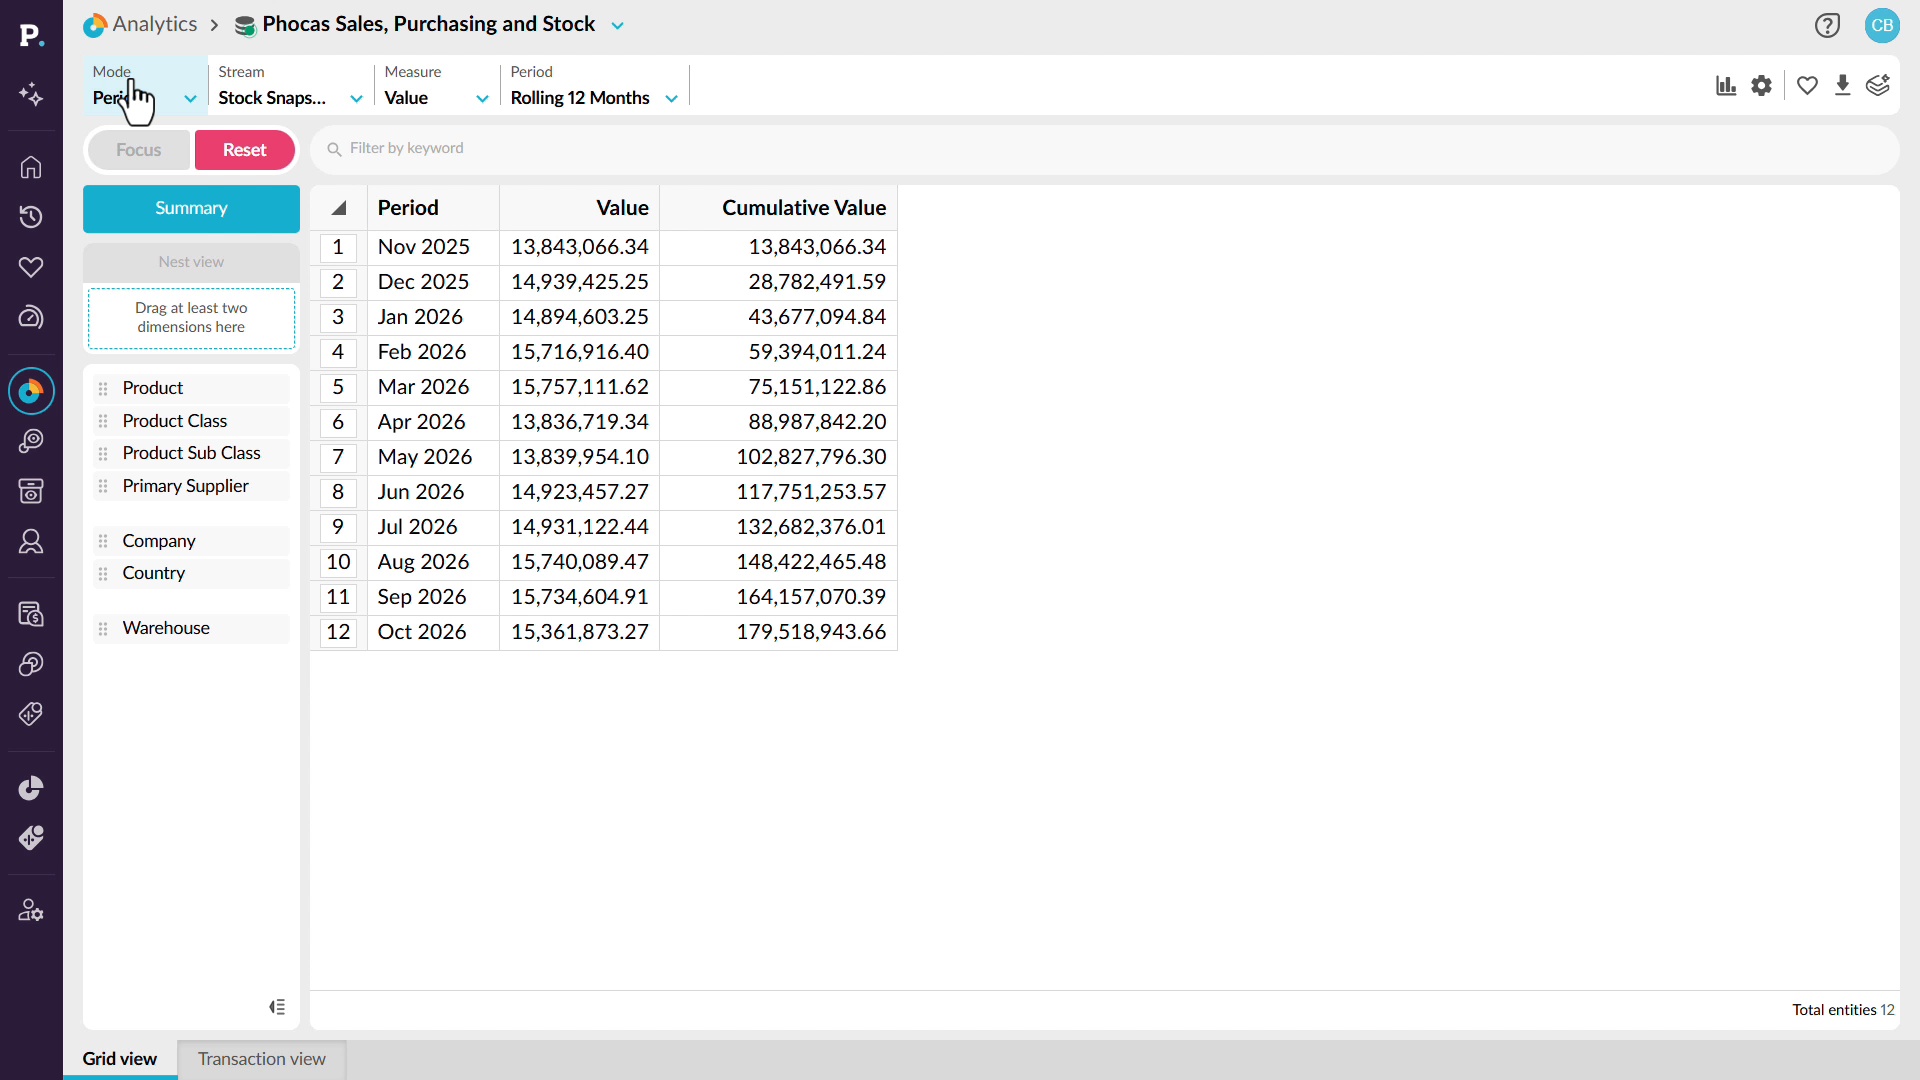
Explain the variance, don't just log it
Get to the bottom of inventory discrepancies instead of repeatedly writing off unexplained variances. See how to use stock snapshots and historical inventory data to investigate changes over a rolling twelve-month period. By switching between data streams, variance analysis, and product dimensions, you can identify where the largest differences occur and drill into the underlying detail. Depending on the data available, you can investigate discrepancies by product, warehouse location, bin, or user. This helps you uncover patterns behind stock variances, understand potential causes of shrinkage, and address recurring inventory issues before they continue costing your business money.
Supporting documentation
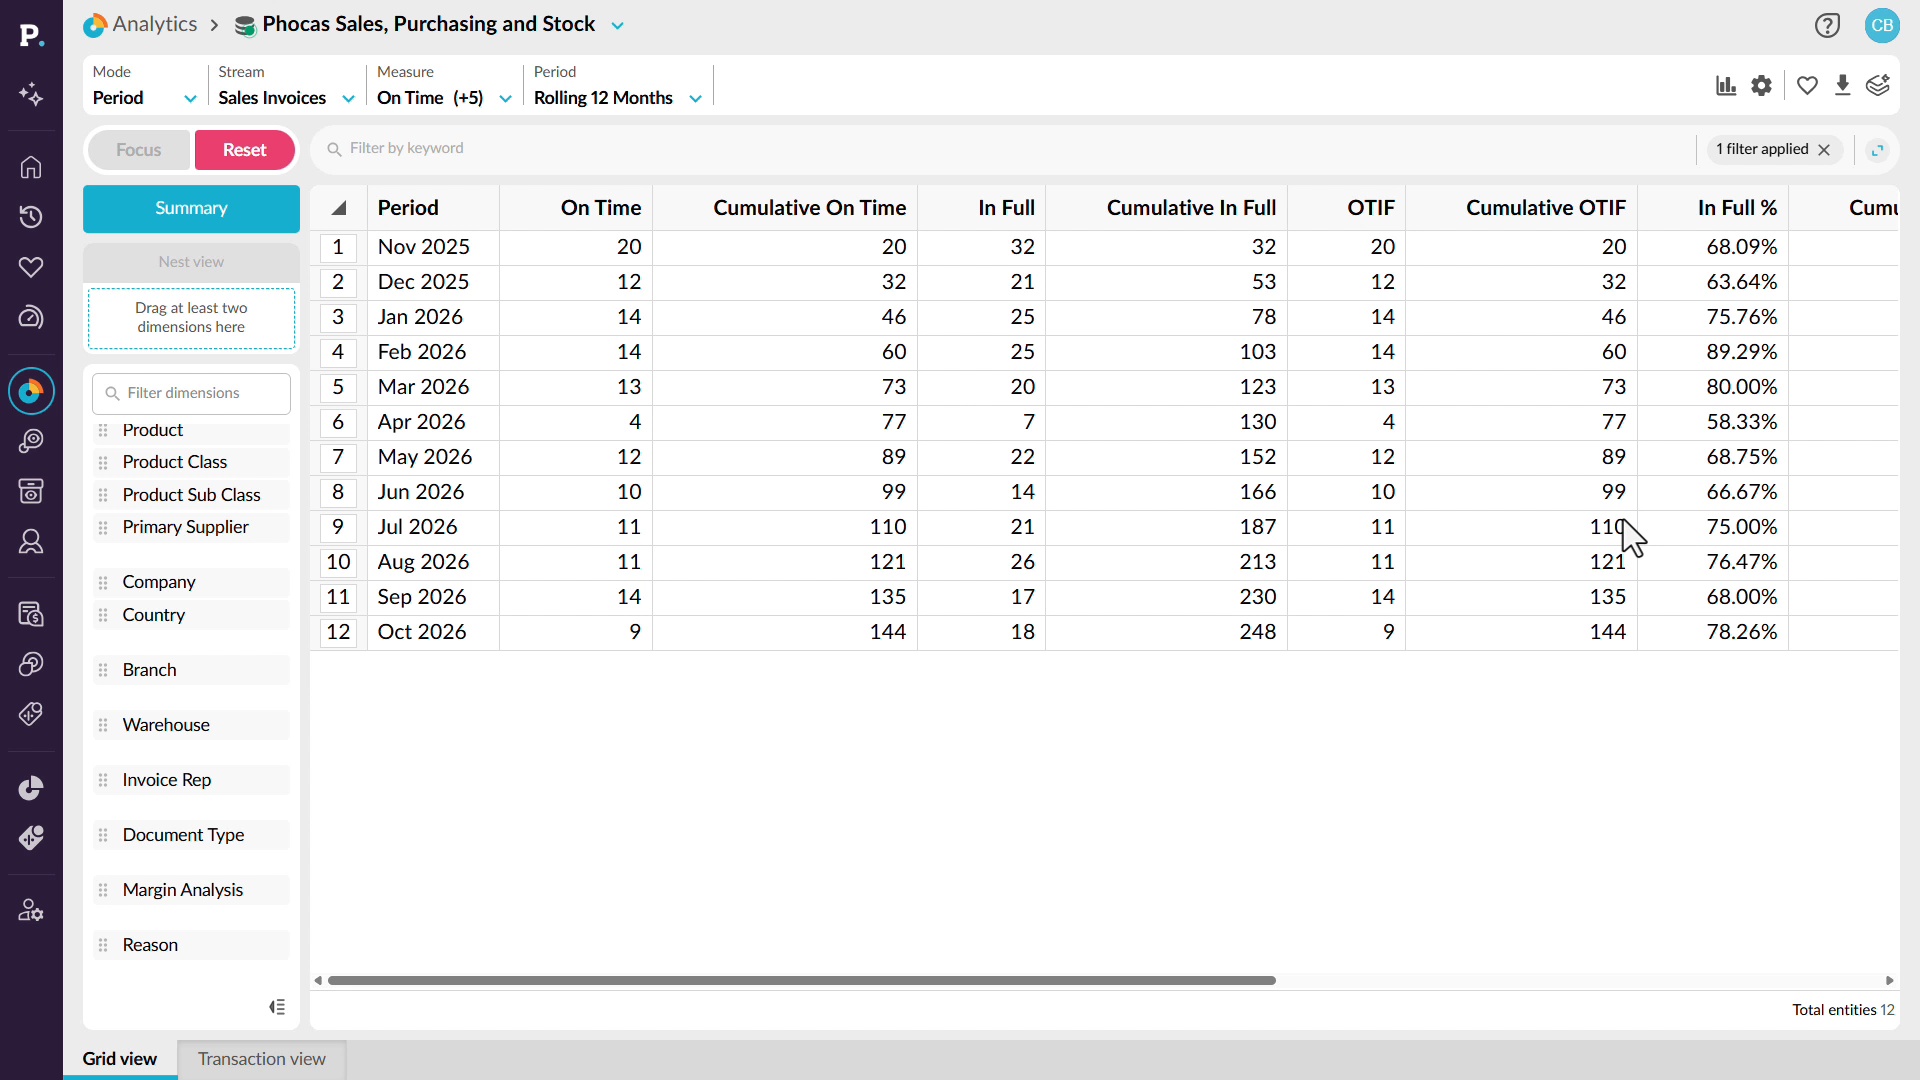
Make OTIF a number you manage
Keep track of on-time, in-full (OTIF) delivery performance so you can identify service issues before they affect customer relationships. See how to bring OTIF measures into your analysis and review performance trends across a rolling twelve-month period. You can investigate months where delivery performance falls, switch to customer-level analysis, and use filters to identify the lowest-performing customers. From there, explore product categories, individual products, and suppliers to understand what's contributing to missed delivery targets. This helps you identify recurring problems, focus on the areas that need attention, and take action to improve delivery reliability.
Supporting documentation
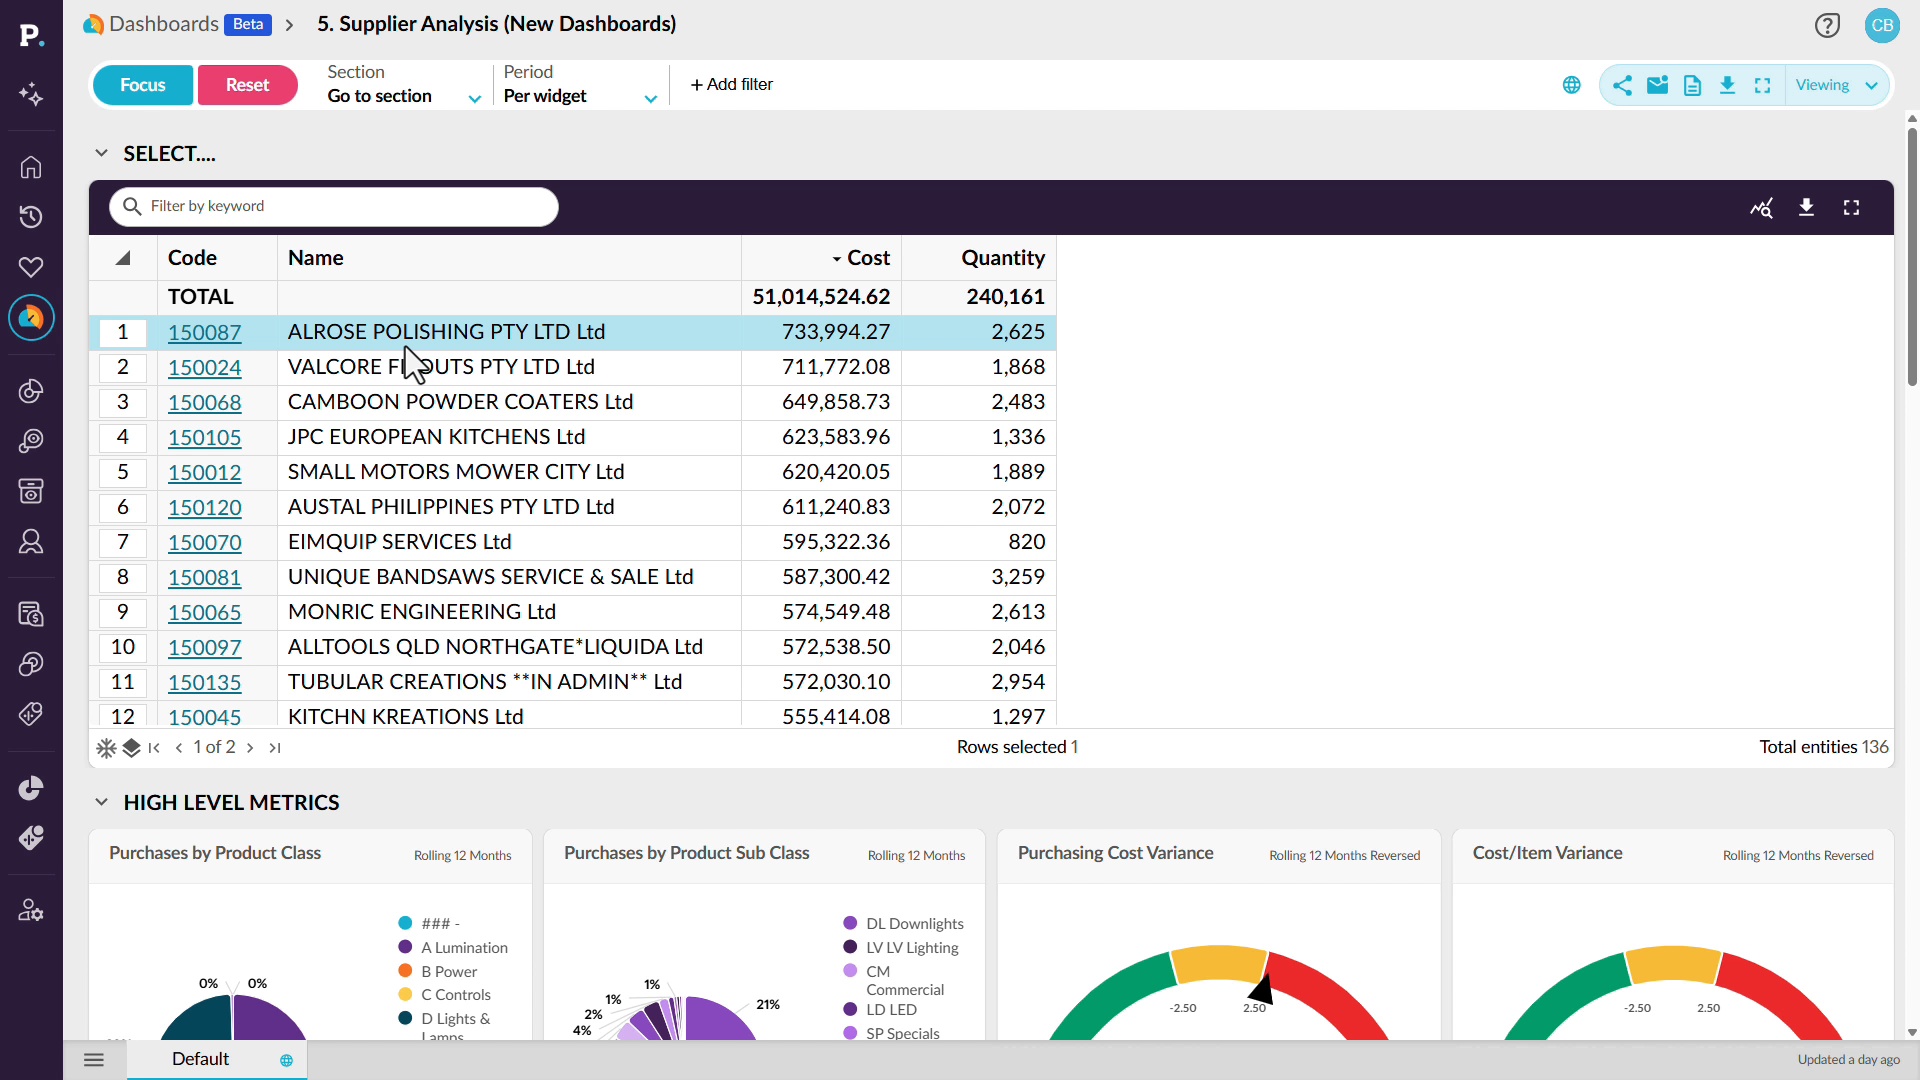
Walk into the negotiation with receipts
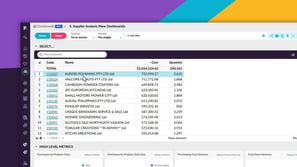
Prepare for supplier negotiations with a clear picture of purchasing activity, costs, and supplier performance. See how a supplier analysis dashboard brings together information such as purchasing costs, quantities, open purchase orders, average order values, and potential price changes. You can filter the dashboard for a particular supplier or product category to review the figures that matter to your discussion. From there, move into detailed analysis to investigate purchasing cost variances, compare trends over time, and drill down to individual purchase order transactions. This gives you the evidence to understand spending patterns, question price changes, and approach supplier conversations with data to support your decisions.
Supporting documentation
Stop losing stock to silence
Identify dead stock and slow-moving inventory before it ties up more cash and warehouse space. See how to combine sales and stock information in the same analysis, then filter for products with no sales activity but stock still on hand. You can sort the results to find your biggest inventory concerns and save the analysis as a favorite, add it to a dashboard, or create an alert. You'll also see how to build custom inventory calculations using sales and stock measures, then compare results across different reporting periods. This gives you a clearer picture of stock movement and helps you make informed purchasing and inventory decisions.
Supporting documentation
Analytics 
Related learning modules
 Analytics
Get started with Analytics
This beginner-friendly module walks you through getting started in Analytics and shows you how to run simple analyses for quick insights. Learn how to explore your data and see how the different modes and features give you the flexibility to view, compare, and analyze your information in ways that work best for you.
 Analytics
Use Analytics
 Analytics
Sales use cases
This module shows how sales teams use Analytics and Workspaces to track rep performance, spot churn risk and cross-sell gaps, and understand margin. Each video works through a real scenario.
 Analytics
Finance use cases
This module shows how finance teams use Analytics to chase receivables, understand margin, and prepare for reviews. Each video works through a real scenario, from aging analysis to dashboards.
