Video tutorials
 Dashboards
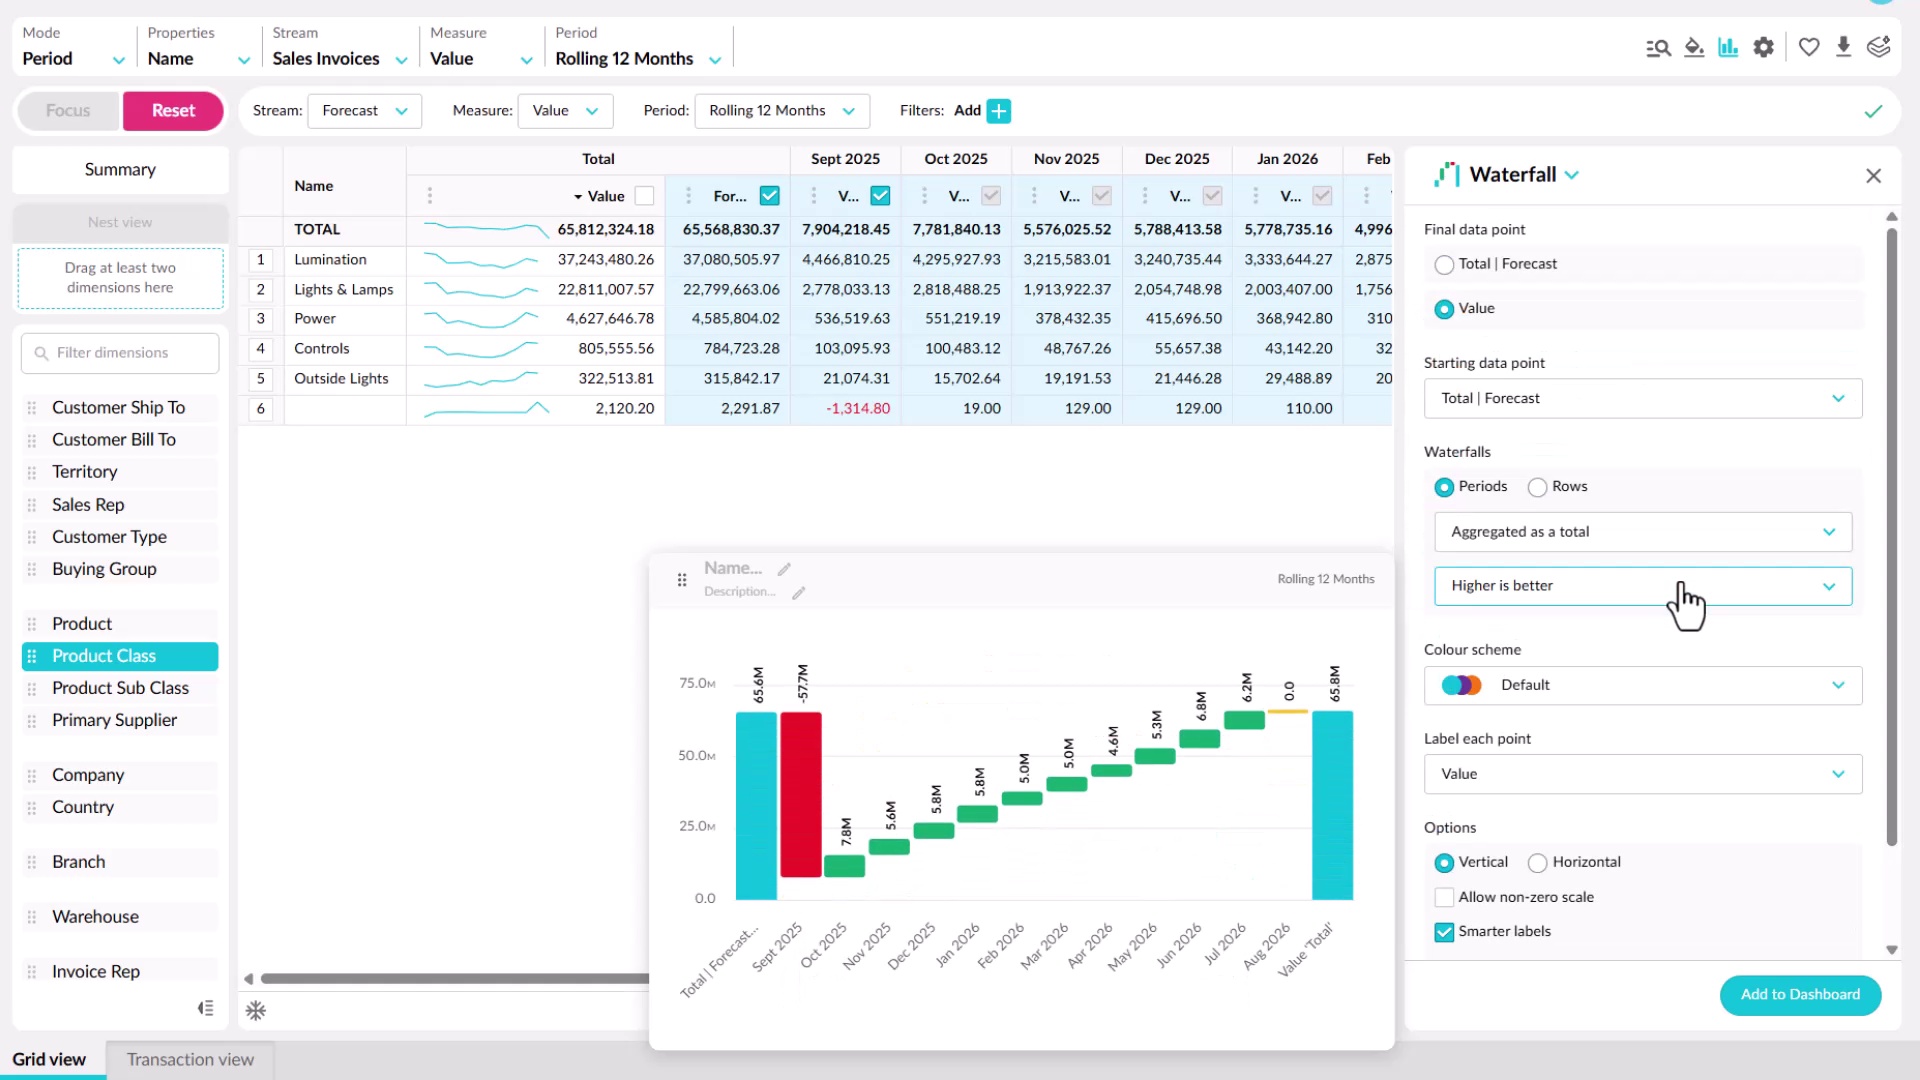
Add a widget to a dashboard
Learn how to add a widget from a dashboard or from Analytics or Financial Statements. You'll choose a chart type for what you want to show, such as bar, line, pie, value card, gauge, or waterfall, set options like colors and whether it responds to filters, then name it and add it to an existing or new dashboard.
 Dashboards
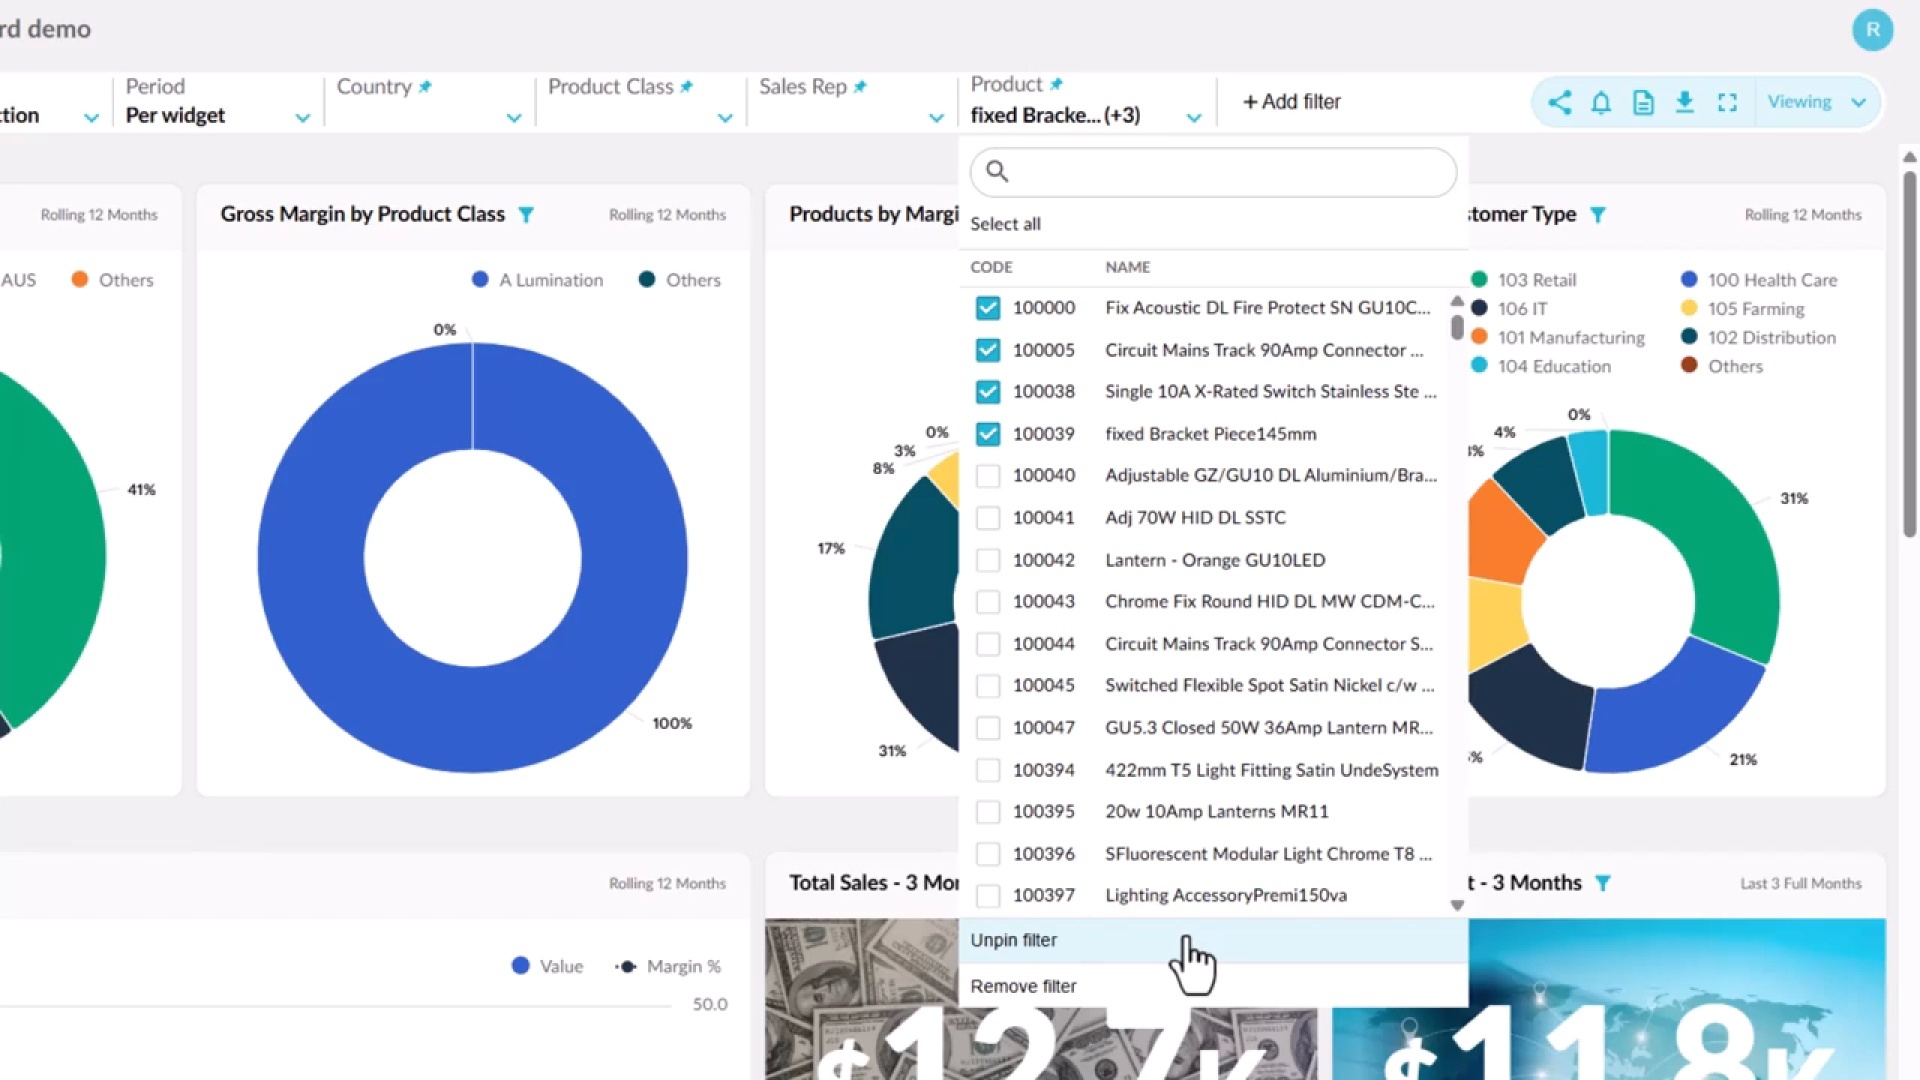
Filter your dashboard
Learn how connected widgets highlight the same entity across a dashboard, and how Focus filters everything down to your selection. You'll add and pin your own filters, see which widgets respond to them, and apply a single period across every widget, then use Reset to return to the default view.
 Dashboards
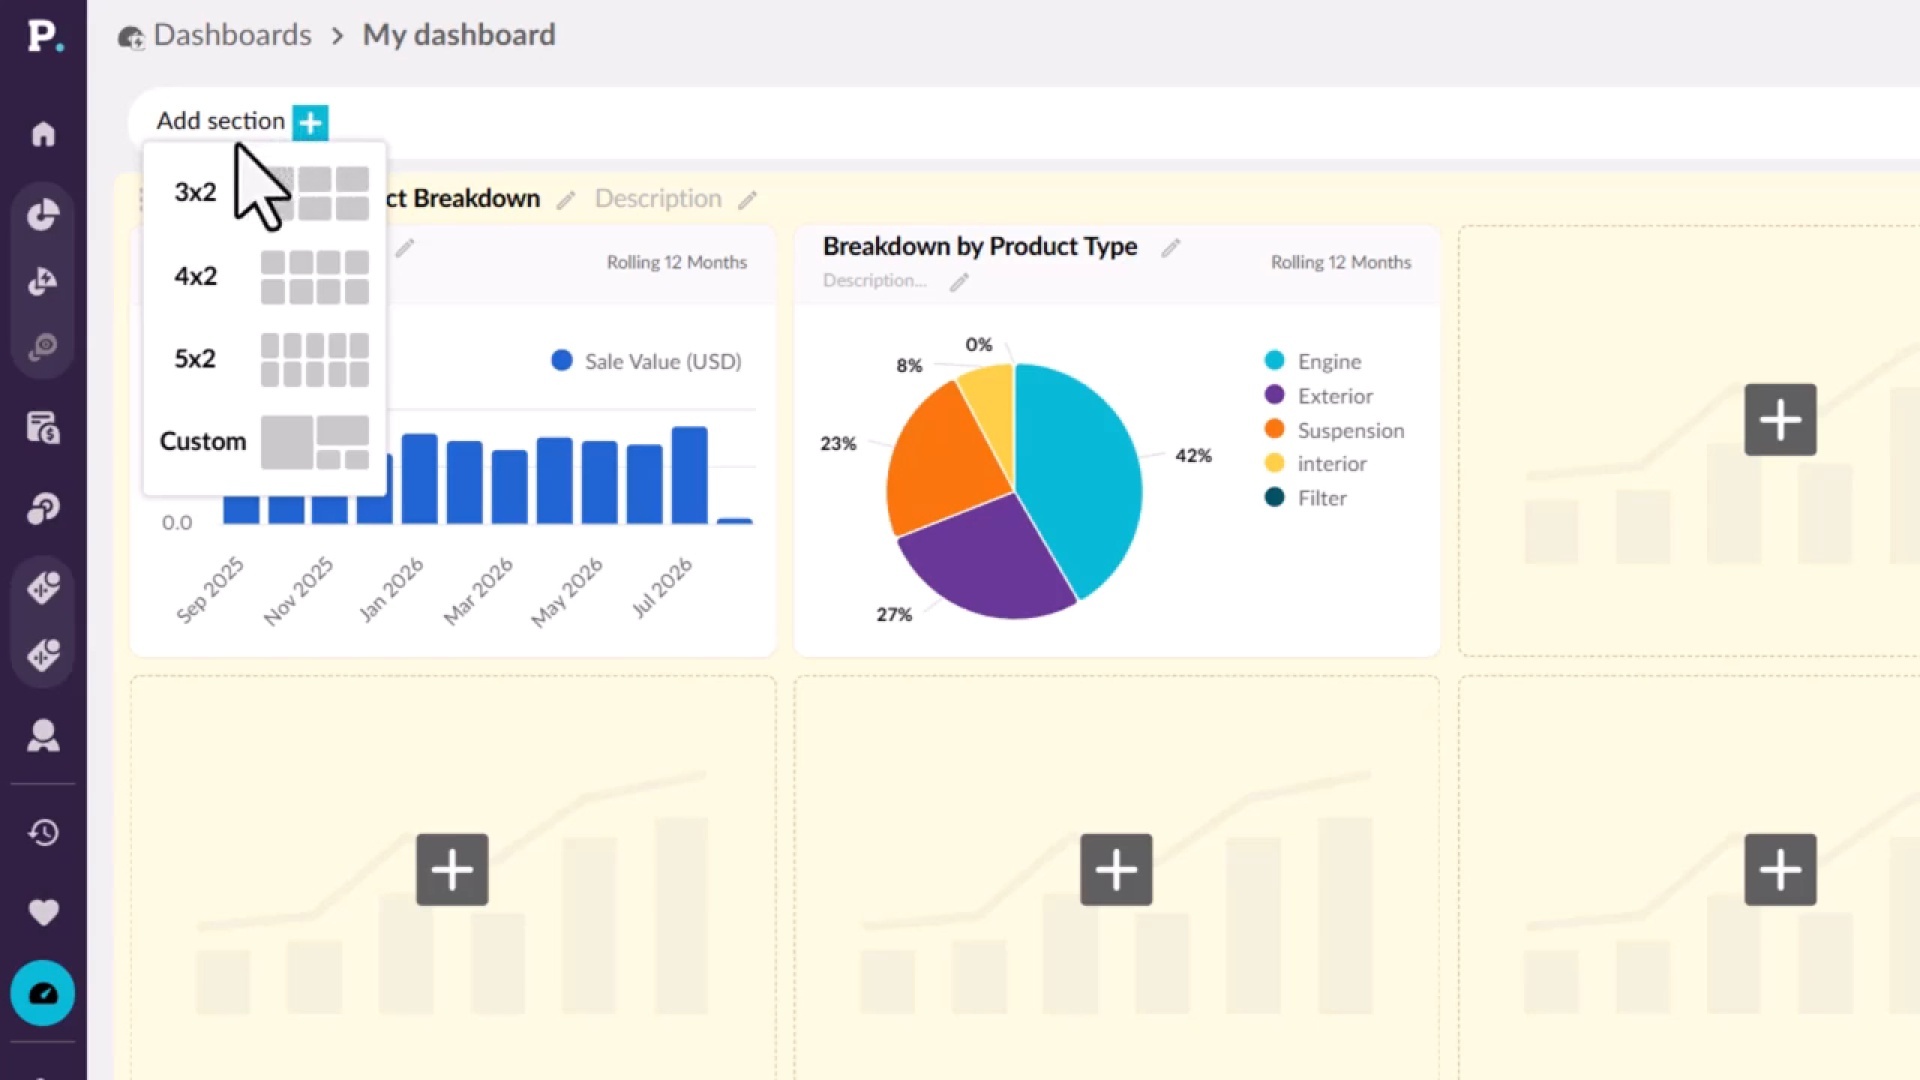
Edit a dashboard
Learn how to shape a dashboard in edit mode, if you have permission to edit it. You'll add sections with preset or custom layouts, add and manage widgets, split a dashboard into tabs, and format its appearance. Your changes stay private until you publish them, and each publish saves a revision you can restore.
 Dashboards
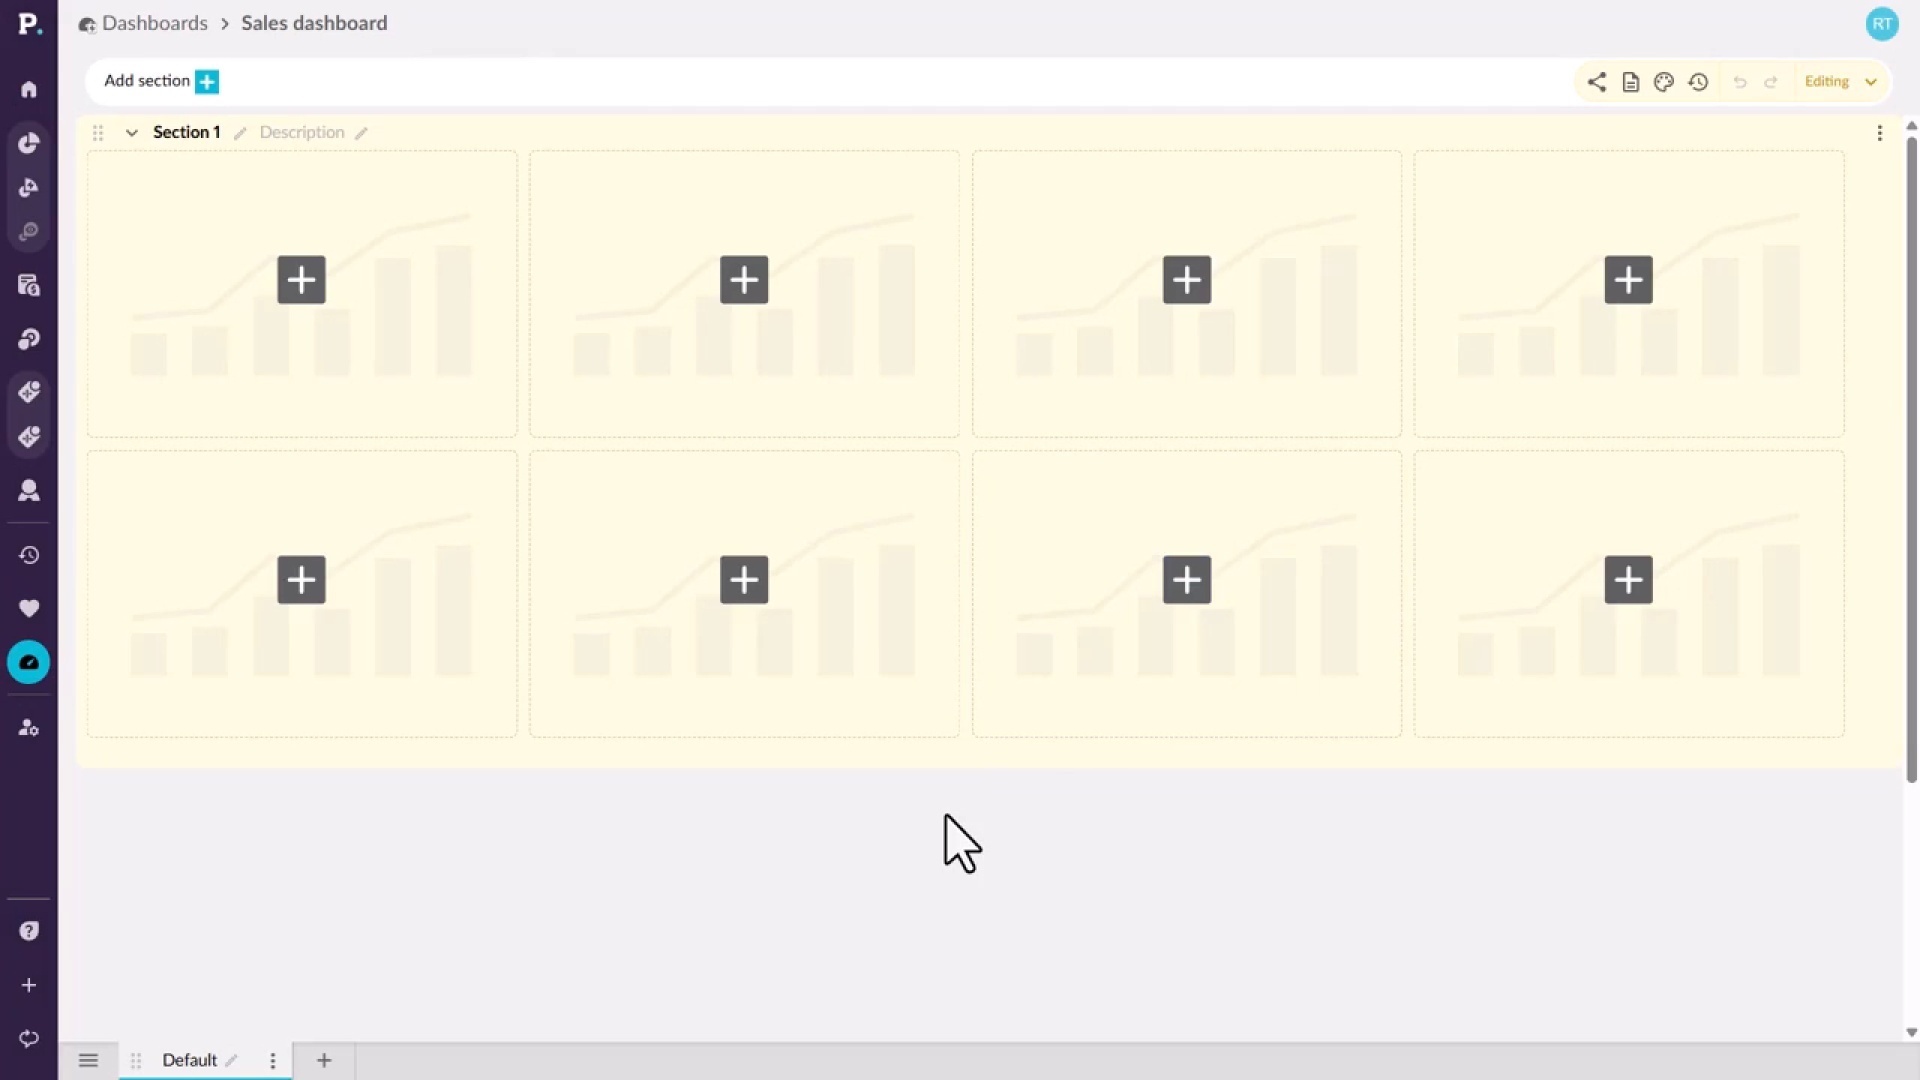
Create a dashboard
Learn how to start a new dashboard from the Dashboards tab on the homepage or from the side navigation menu. You give it a name and an optional description, which appears under the name on the homepage, then create it and open it, ready to build.
 Dashboards
Use a dashboard
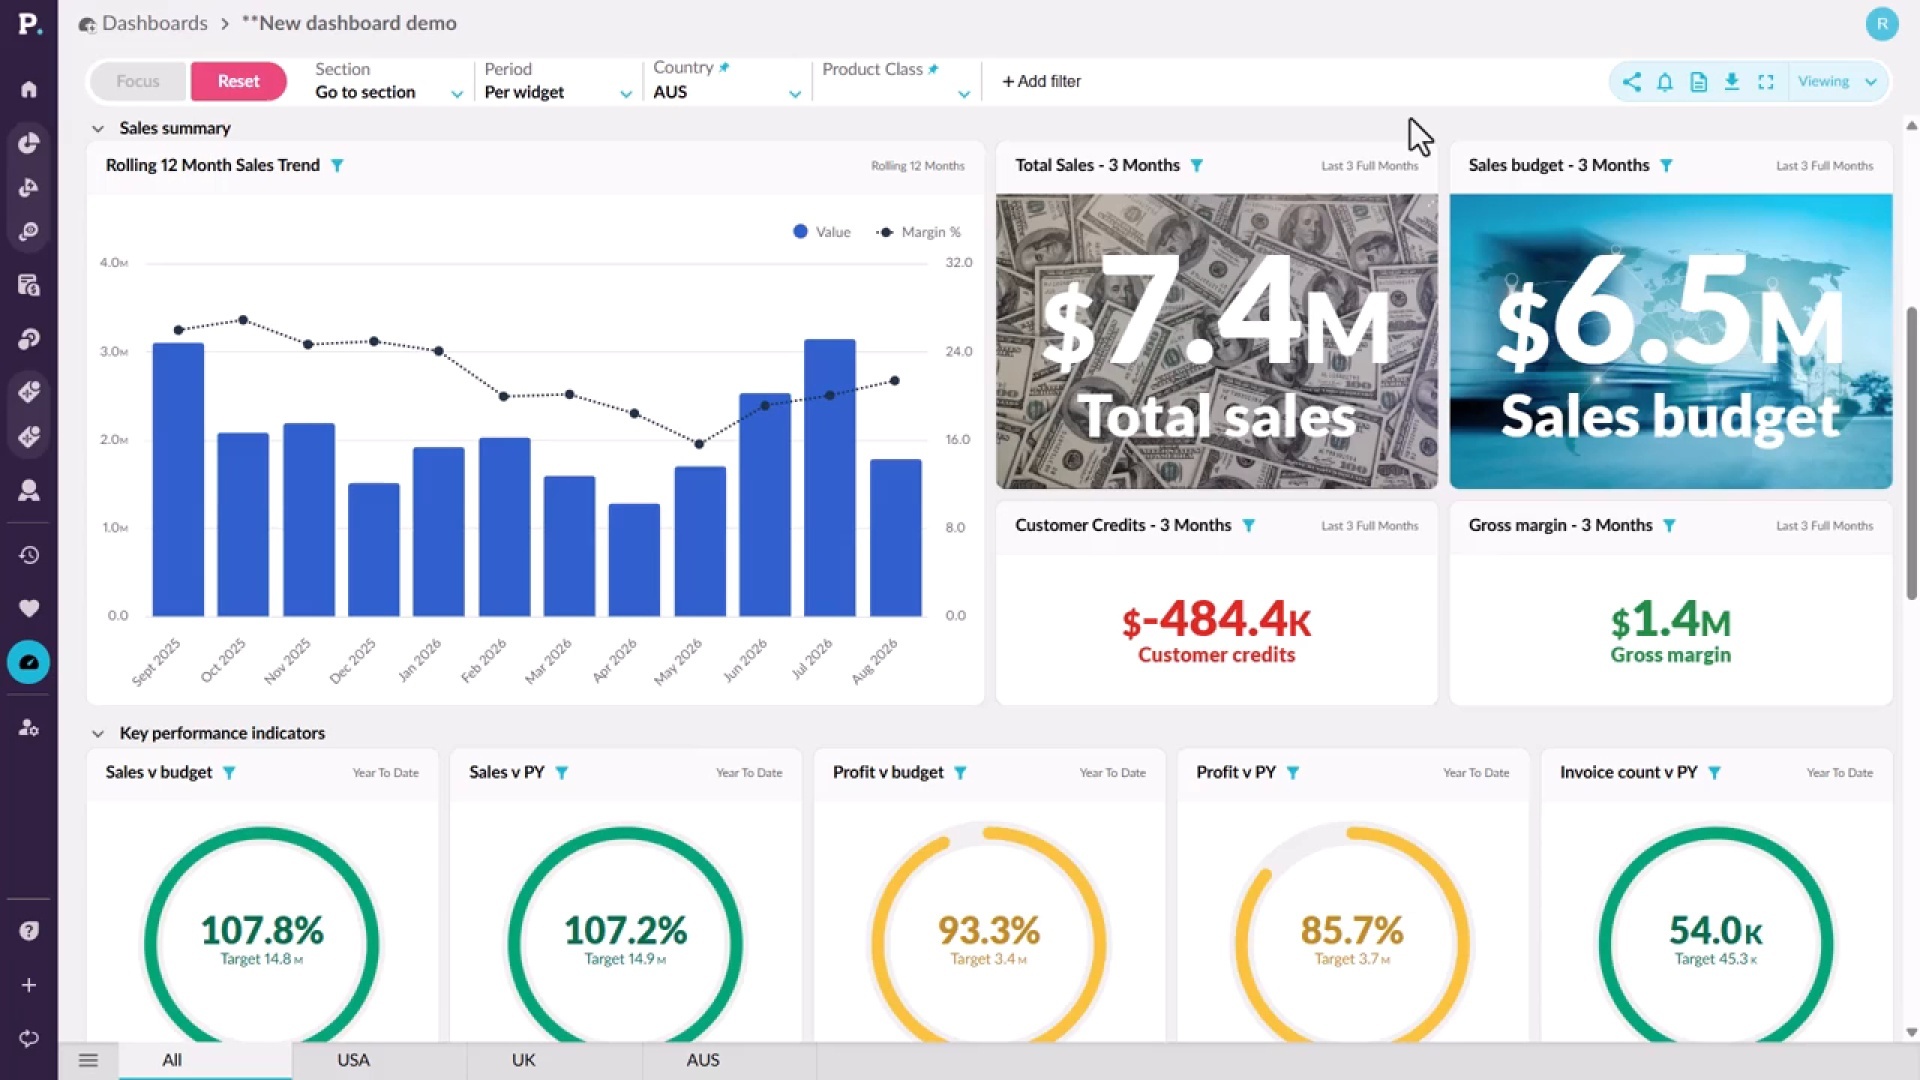
Learn how to find the dashboards you have access to and explore them. You'll select data in a chart and choose Focus to filter every widget, add and pin dropdown filters, apply one period across all widgets, and open a widget's data in the grid with Analyze. You can also share a dashboard, download it as a PDF, or view it full screen.
 Analytics
See margin next to every sale
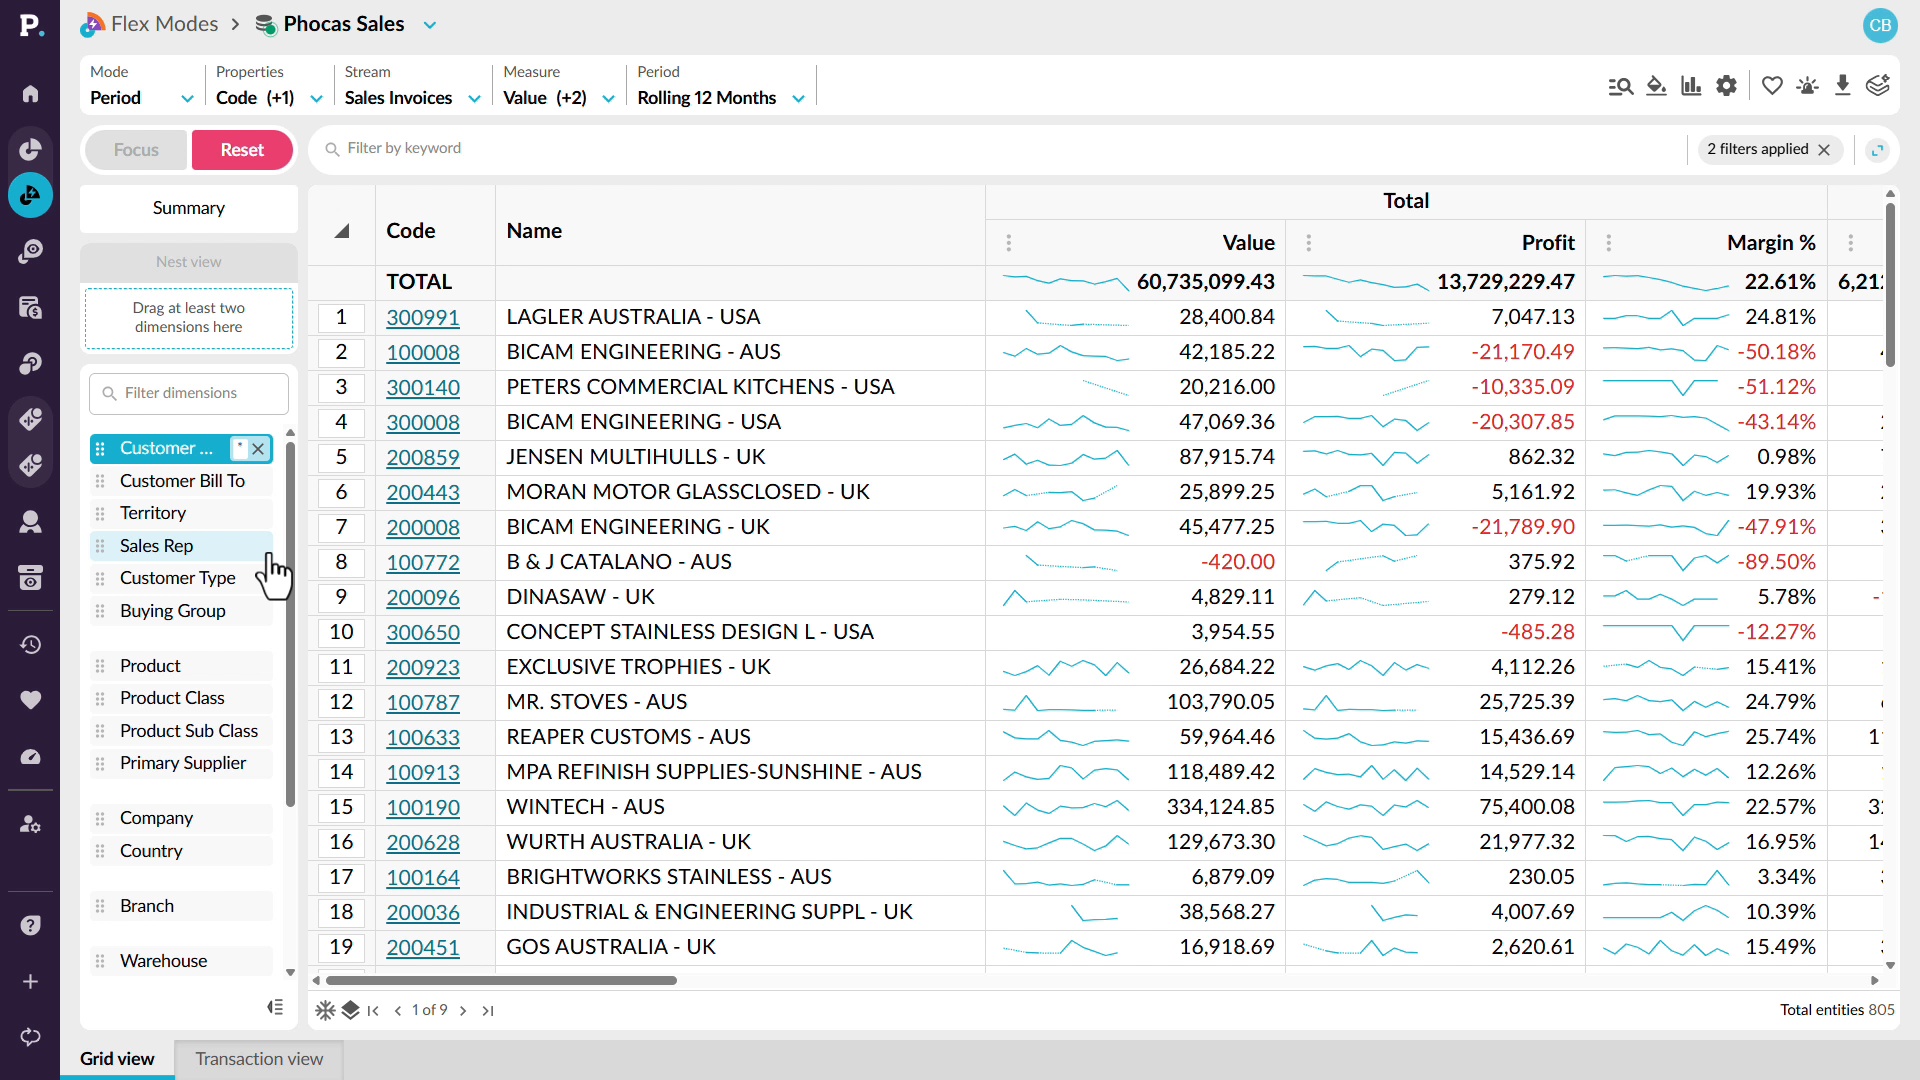
Learn how to see what you made, not only what you sold, by adding profit and margin next to sales in Analytics. Spot a dip in margin percentage over time, break it down by customer and month, and sort to find customers with negative margin. Then drill into the transactions behind them to help reps focus on worthwhile accounts and catch a bad discount early.
 Analytics
See cross-sell gaps across every account
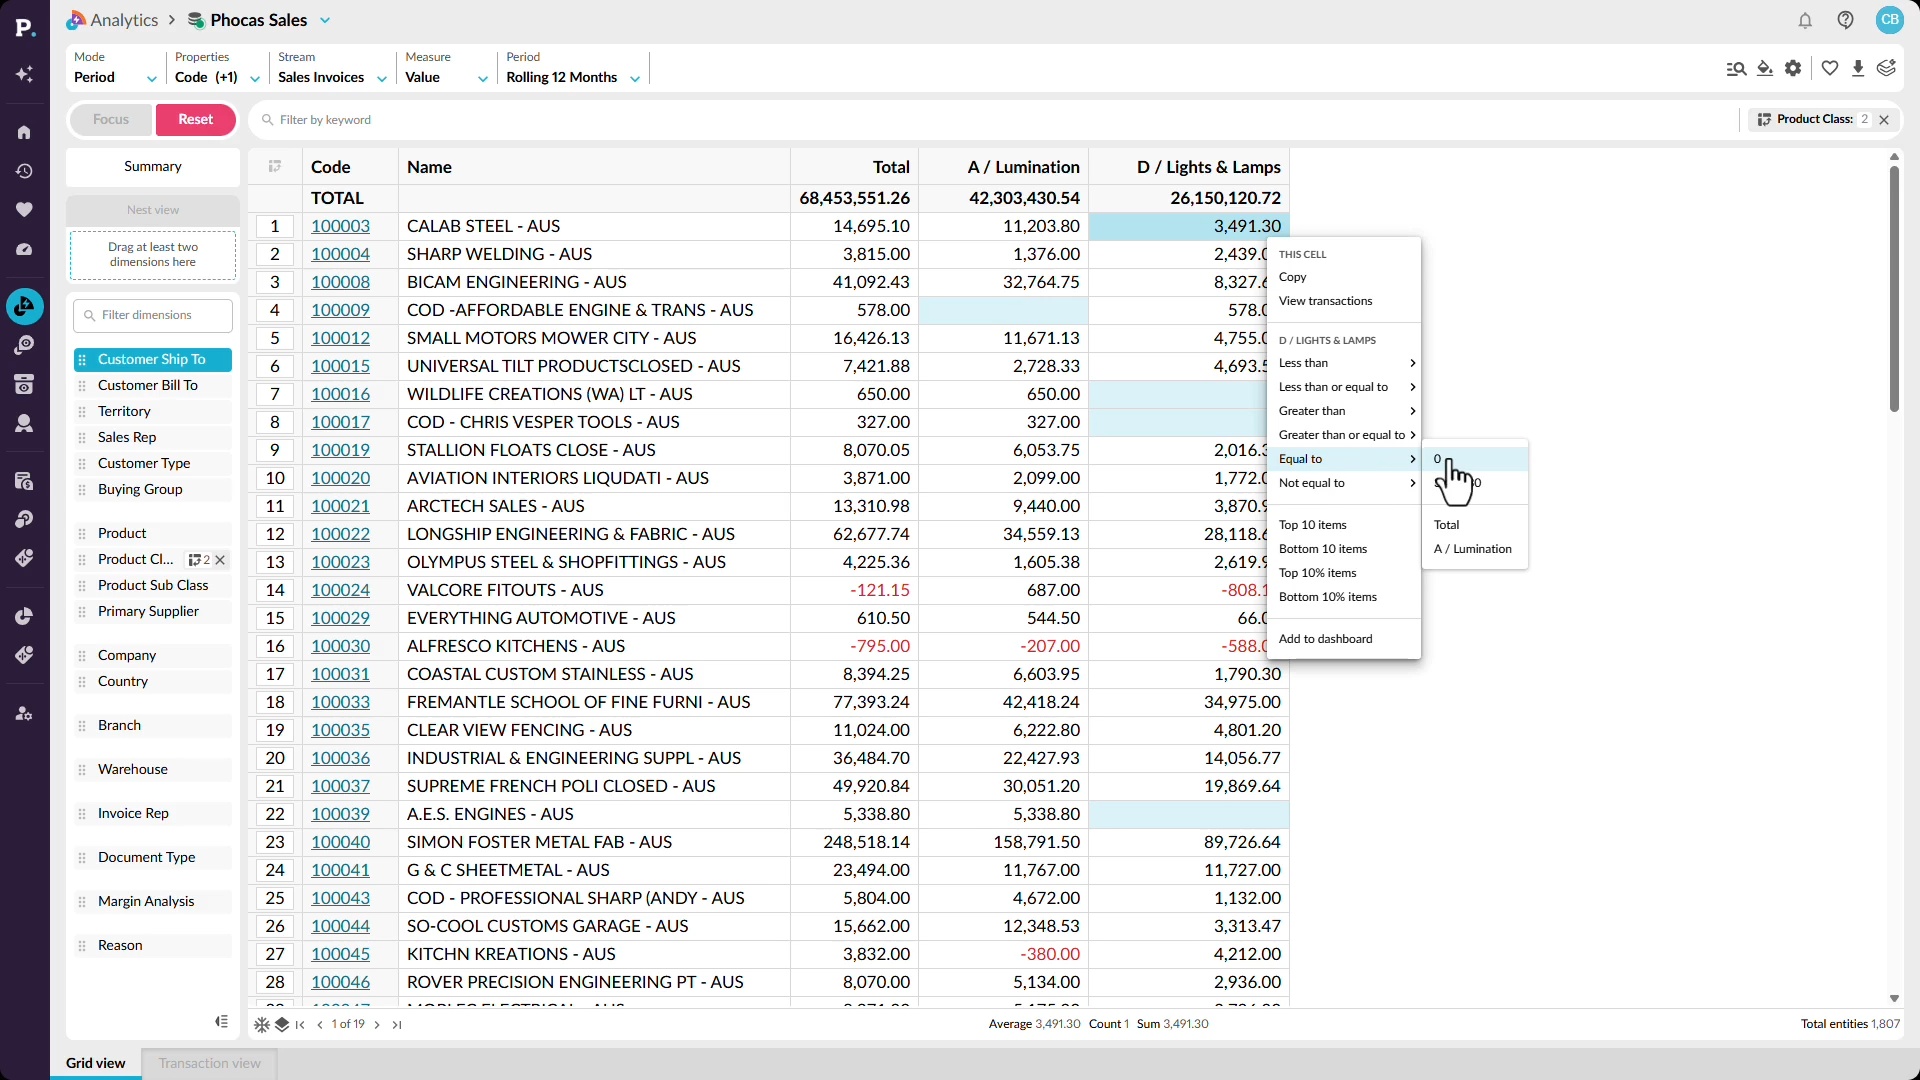
Learn how to identify cross-sell gaps across every account, not only the ones you remember. Ask Workspaces which customers buy one product class but not another to get a customer list, then use Analytics to compare two related product categories by customer and filter to customers with zero sales in one of them, so reps can walk in ready to sell more.
 Analytics
See churn risk across your whole patch
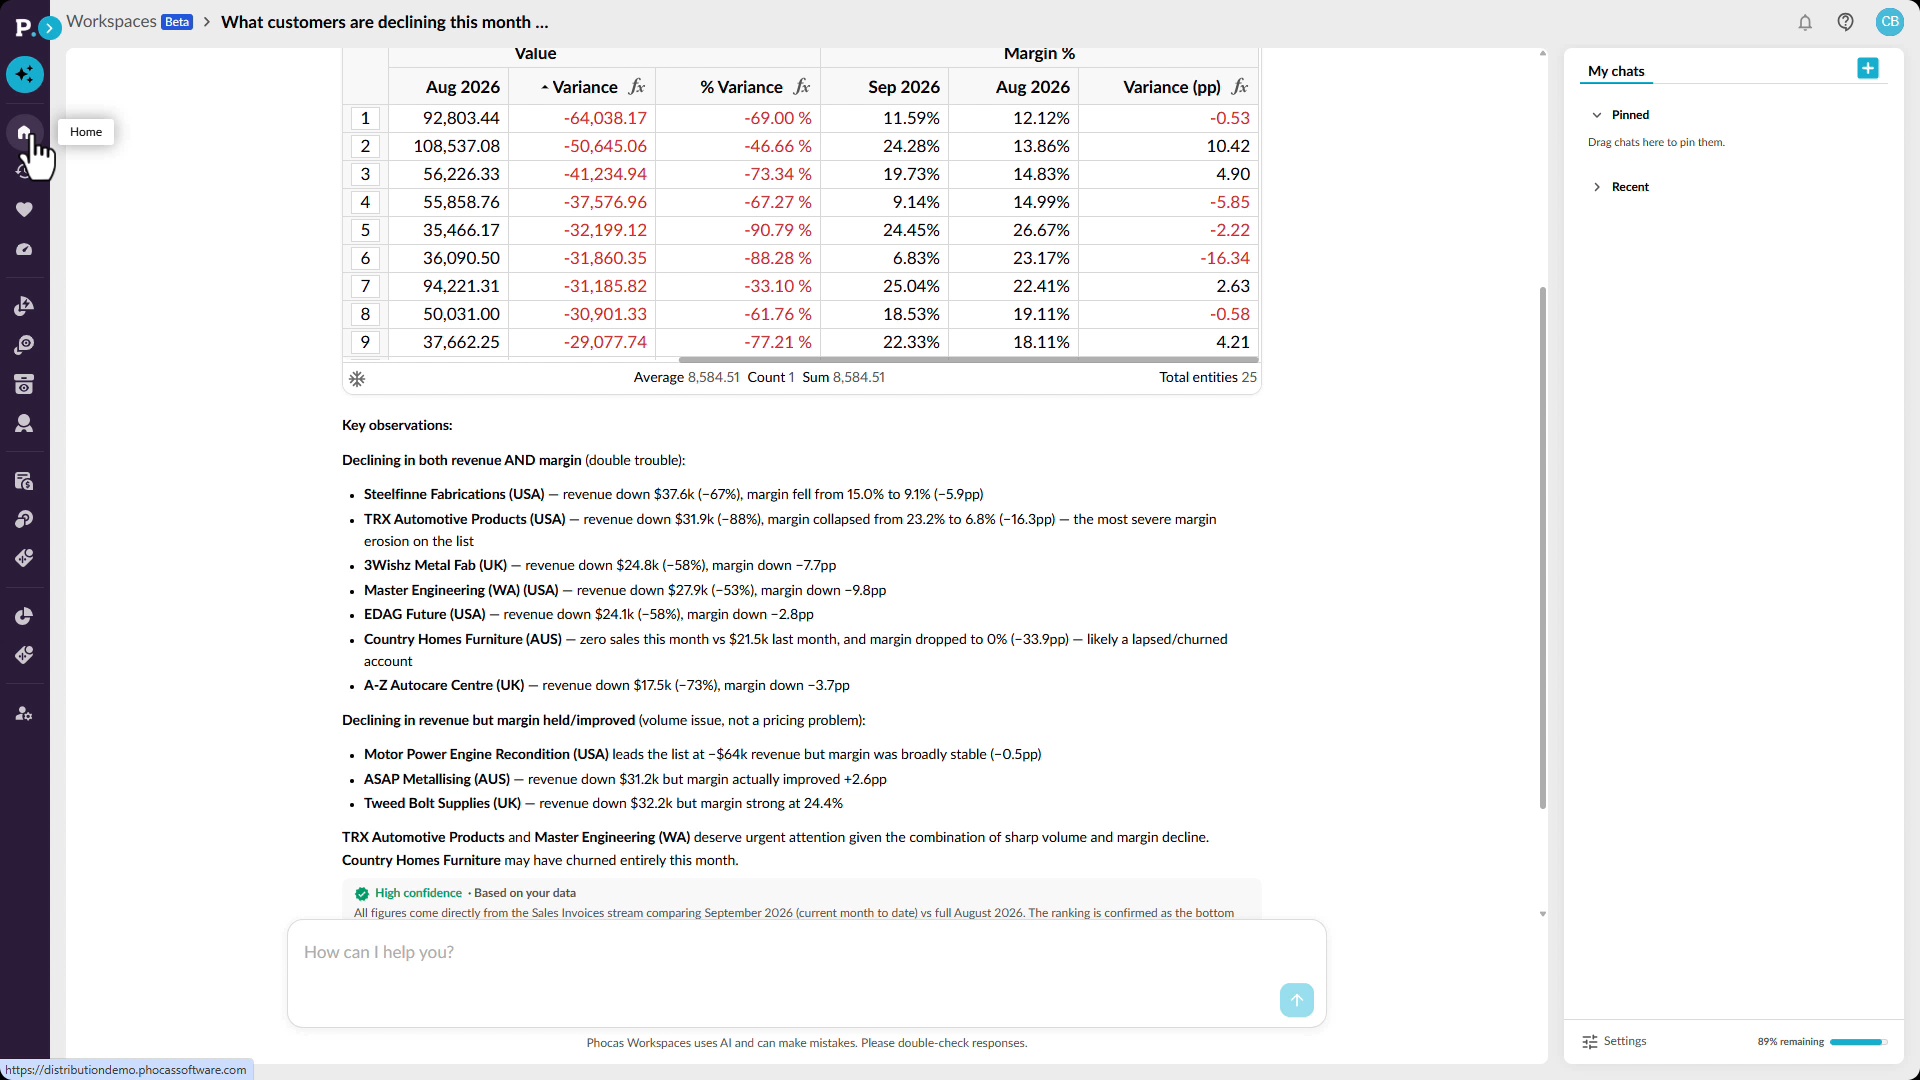
Learn how to see which customers are slipping and who to call first. Ask Workspaces which customers are declining in sales and margin this month, then compare month over month in Analytics to surface customers whose sales fell across three consecutive months. You can make the report dynamic so it updates as new sales come in, and share it with your reps.
 Analytics
Get your own answer in seconds
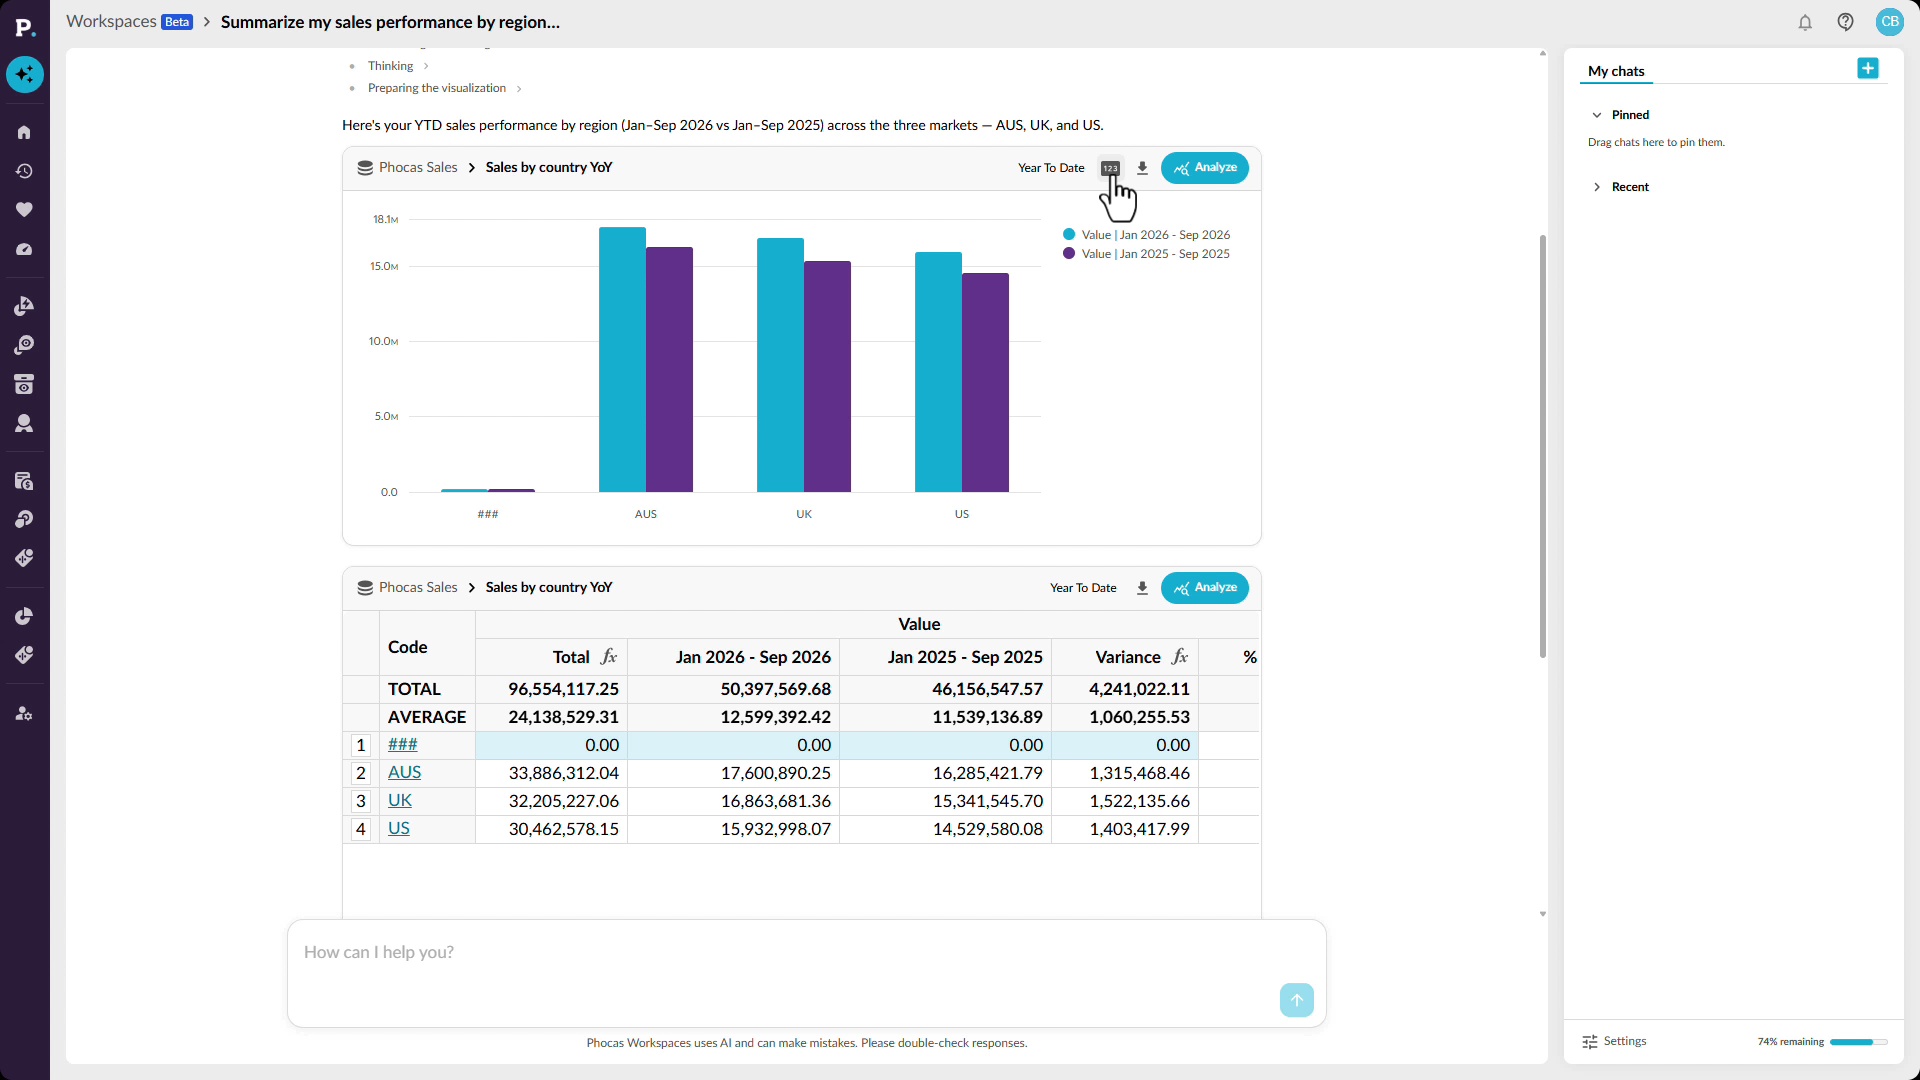
Learn how to answer a sales performance question yourself by asking Workspaces in plain language, such as a regional comparison of this year against last. You get a chart, a grid with figures like profitability, and a confidence score, and you can open the full report to dig into what's driving the trends. Save it as a favorite, add it to a dashboard, or export it.
 Analytics
Catch an off-track rep in time
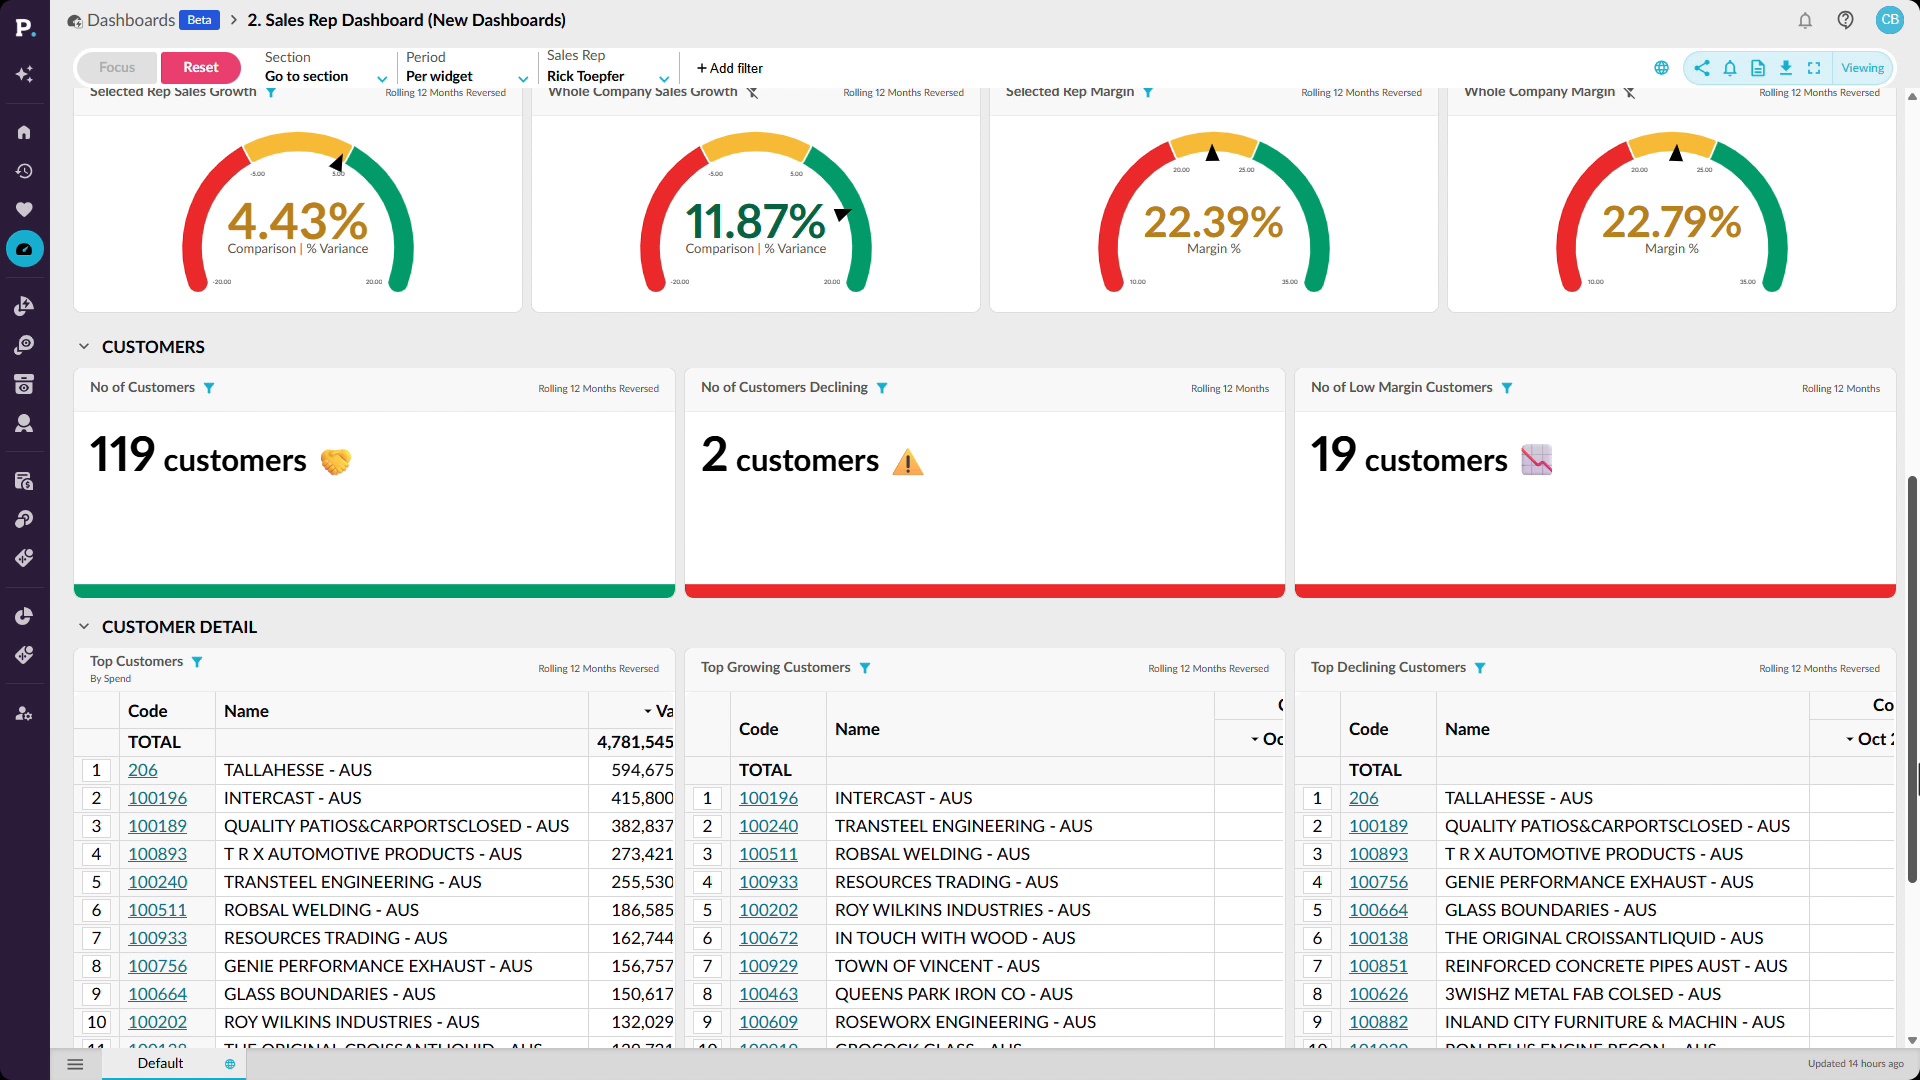
Learn how to put rep performance against quota into your team's hands with a dashboard that updates automatically and filters by salesperson or region. Then compare sales with budget year to date by rep and isolate those running below budget, so you can step in early. Add the report to a dashboard, save it as a favorite, or export it.
 Analytics
Stop losing stock to silence
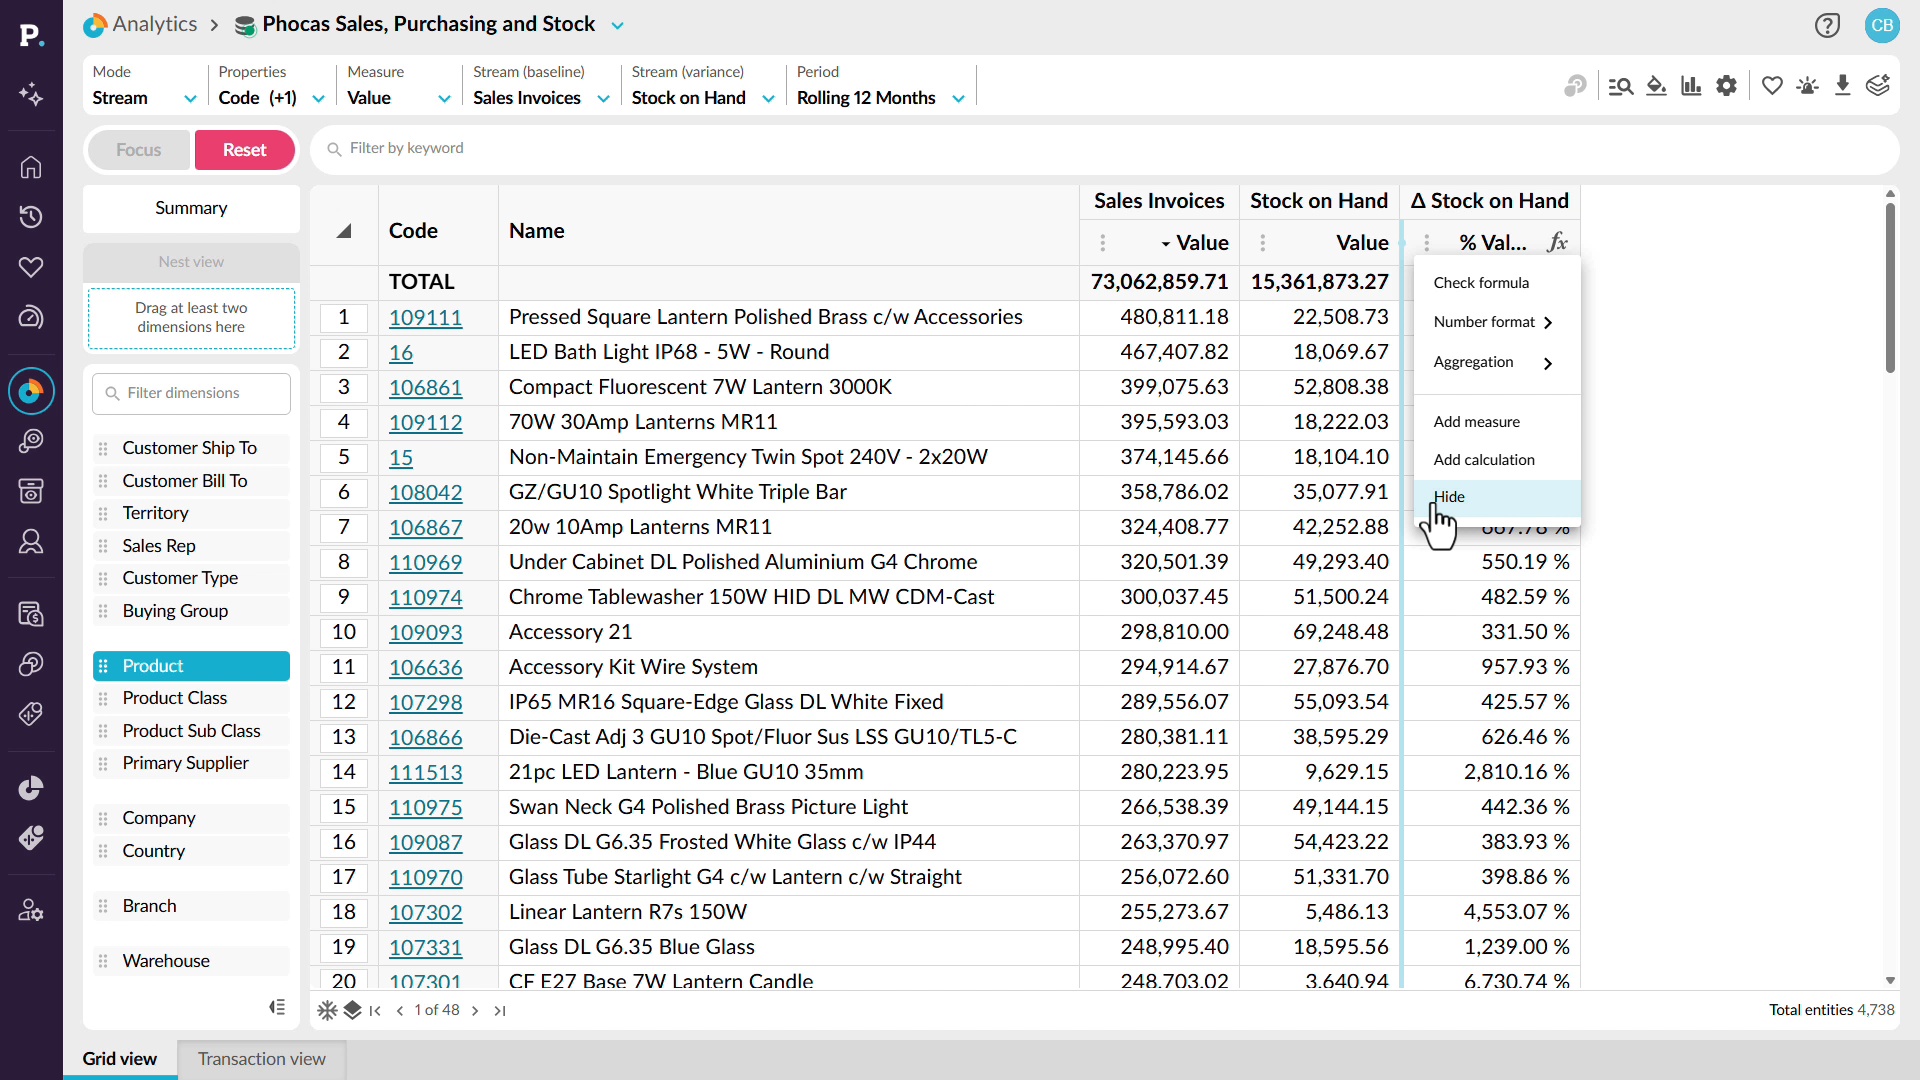
Learn how to catch dead stock before it ties up cash and warehouse space. You'll filter for products with stock on hand but no sales, sort to find the biggest outliers, and build an inventory turns calculation you can duplicate for other periods. Save any result as a favorite, add it to a dashboard, or create an alert.
 Analytics
Walk into the negotiation with receipts
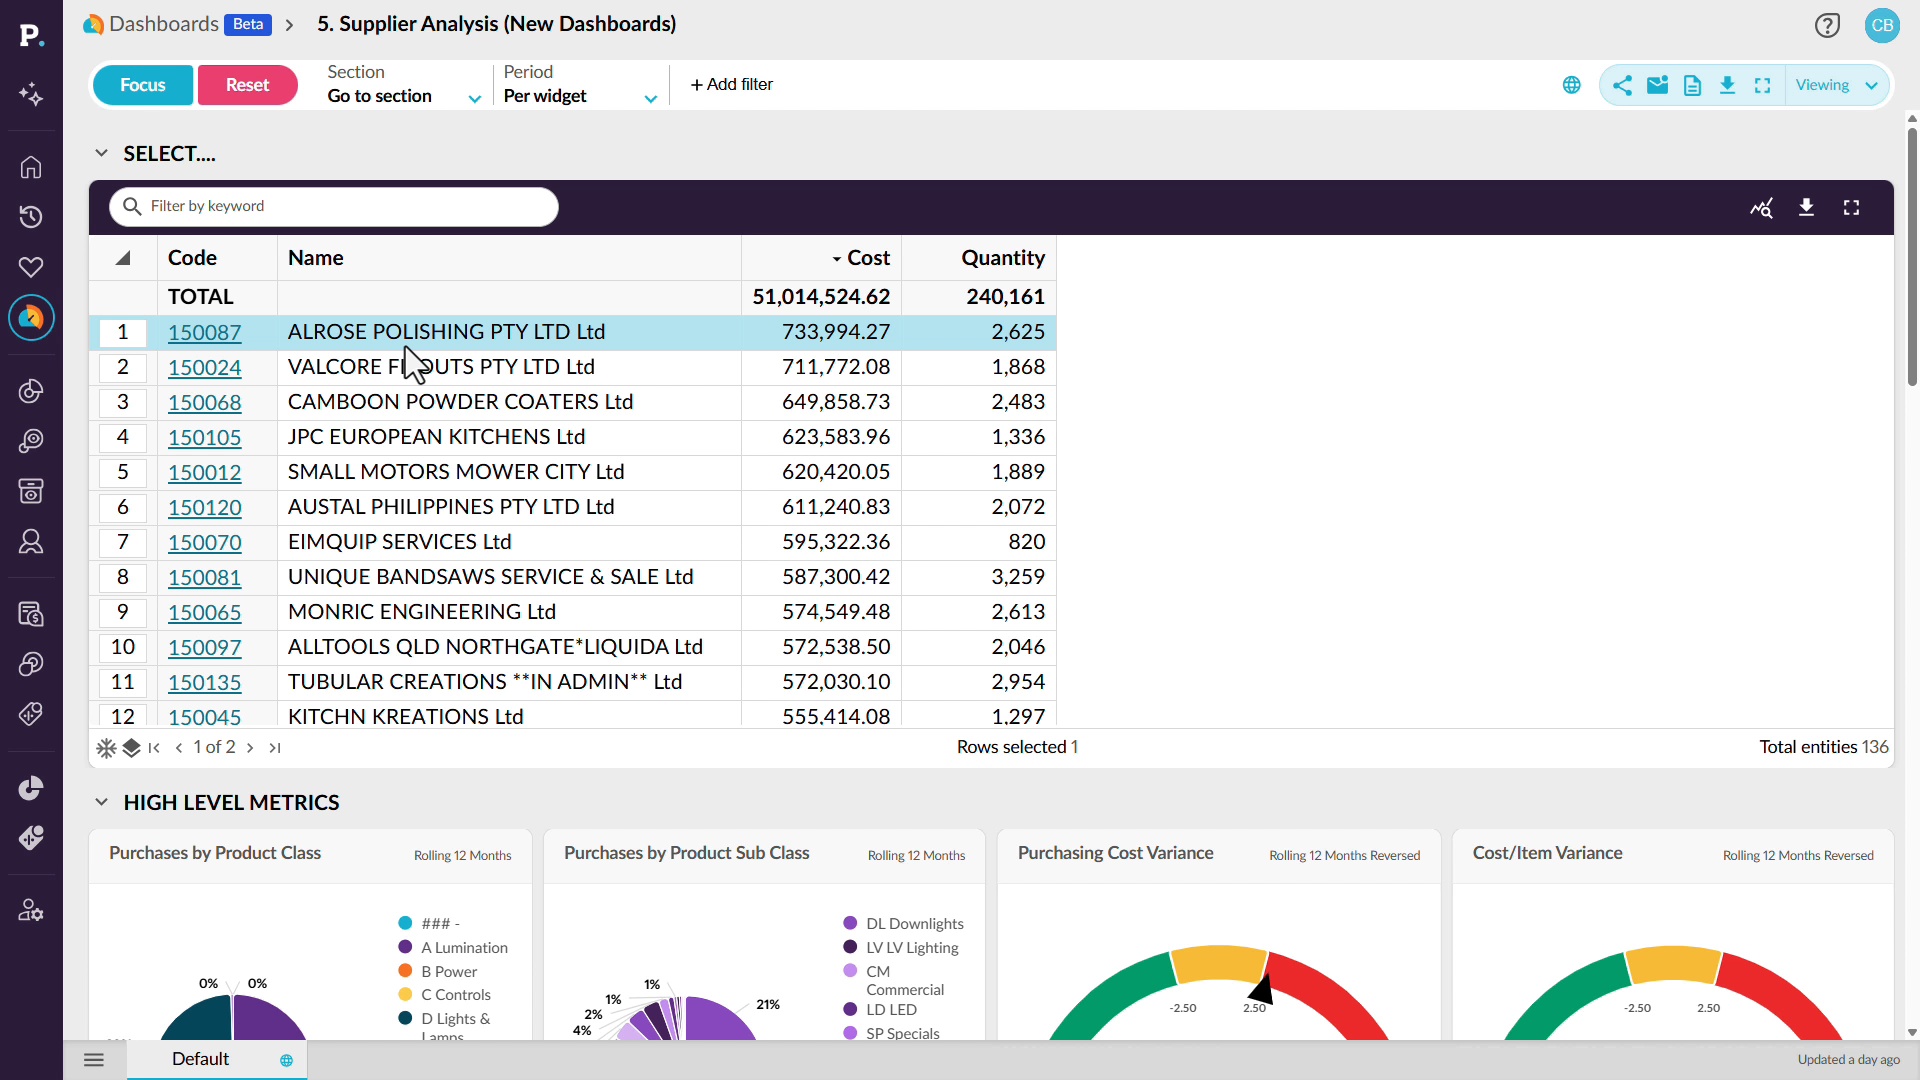
Learn how to go into supplier conversations with data on what you've spent and how each supplier has performed. You'll filter a supplier analysis dashboard to one supplier, review cost, open purchase orders, and price changes, then analyze a widget in its source data to see cost variances, trends, and individual purchase orders.
 Analytics
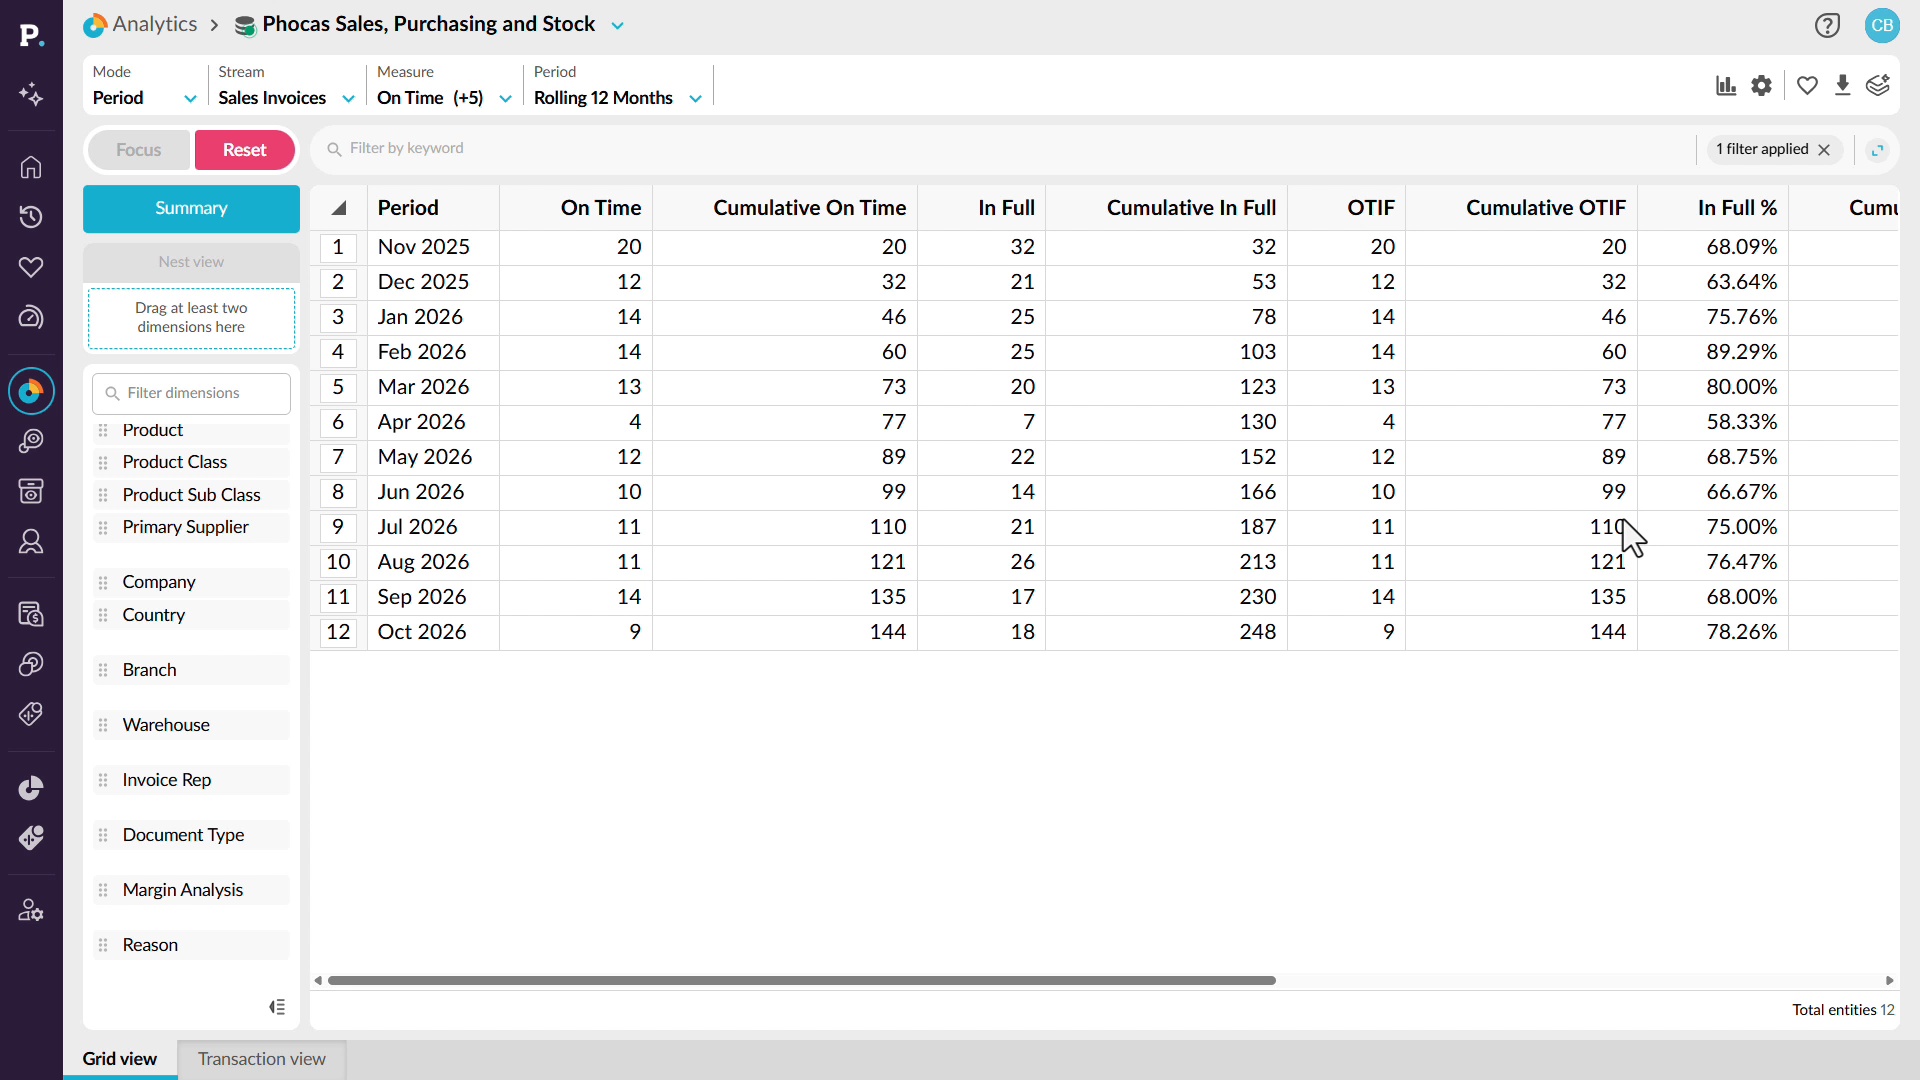
Make OTIF a number you manage
Learn how to spot late or incomplete deliveries before your customers raise them. You'll bring on time in full measures into a 12-month view, find the months where performance slips, then filter to your weakest customers. From there you can drill into product categories, products, and suppliers to see what's driving the misses.
 Analytics
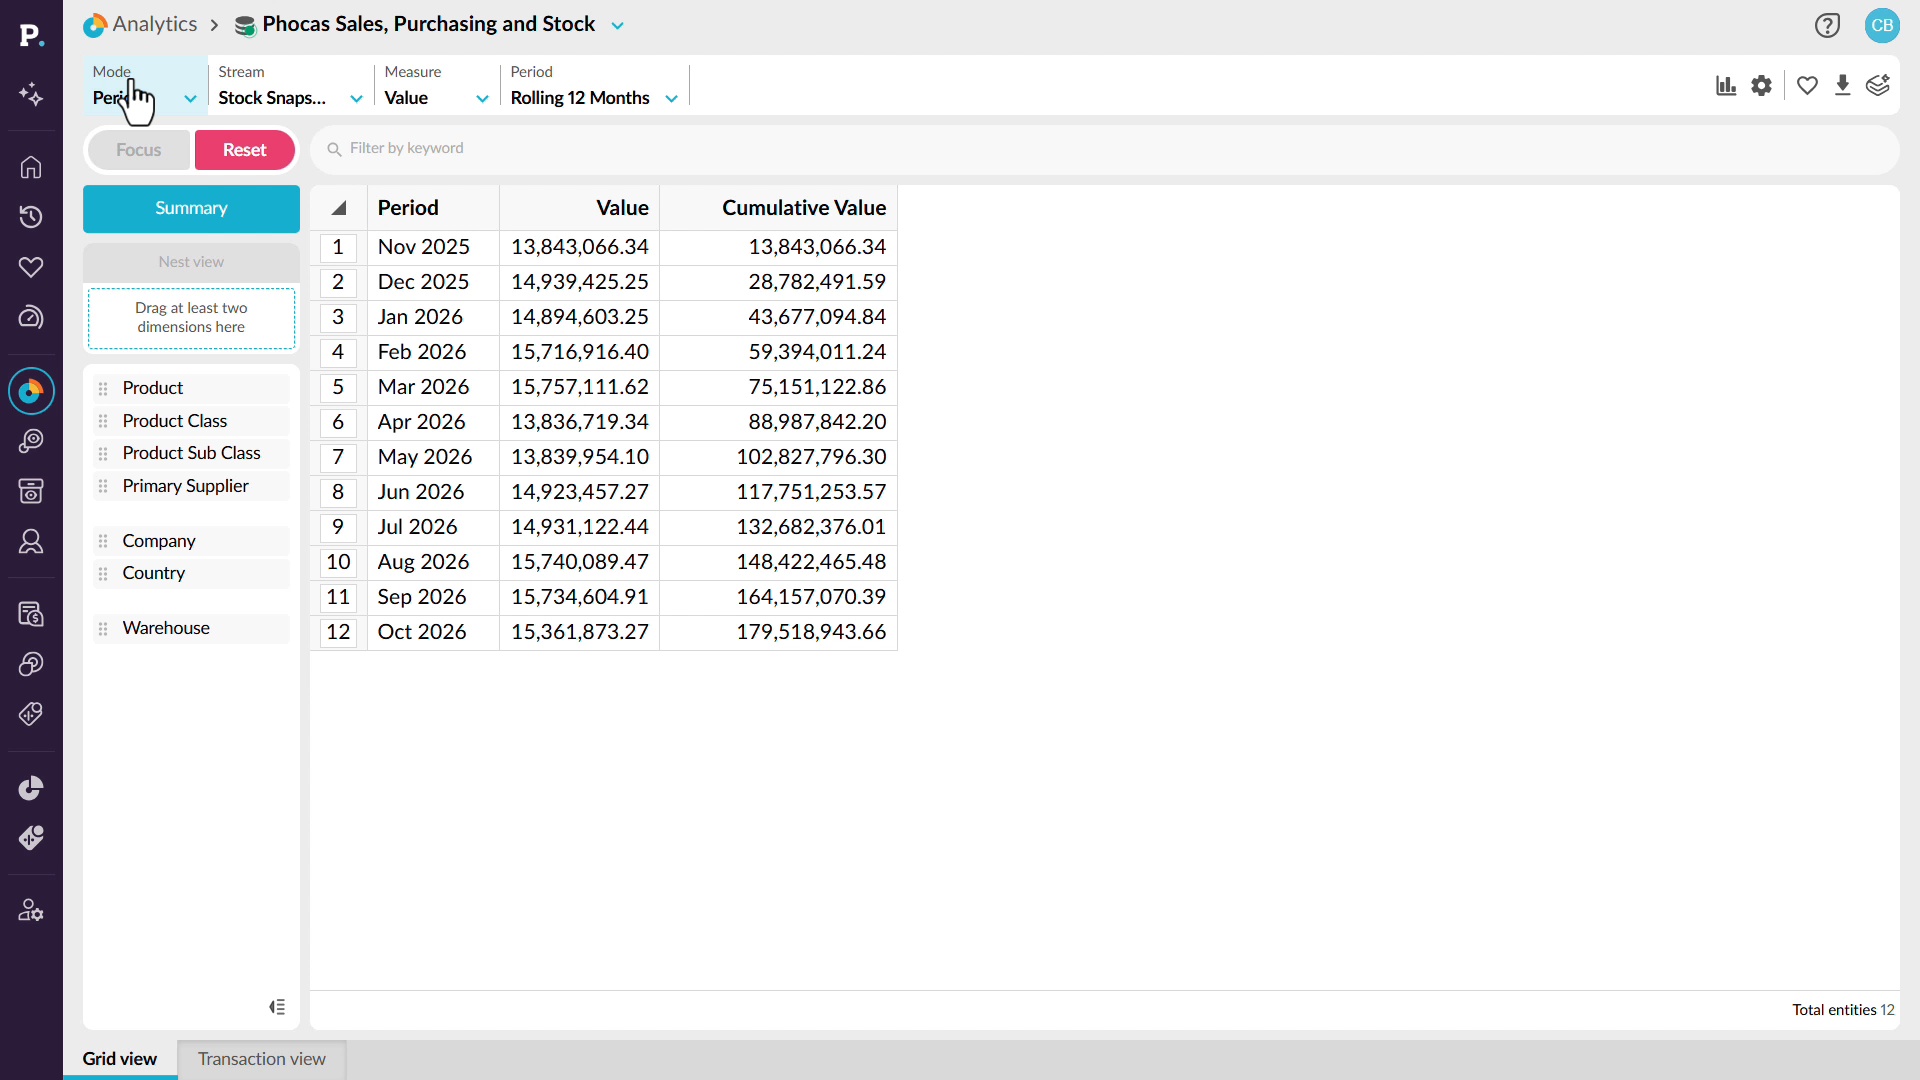
Explain the variance, don't just log it
Learn how to find the cause of cycle count and adjustment variances so they stop recurring. You'll view a stock snapshot over 12 months, switch to variances, and compare product groups to spot the largest discrepancy. Drilling into that item turns unknown shrinkage into a specific pattern or location, such as a bin or user, where your data supports it.
 Analytics
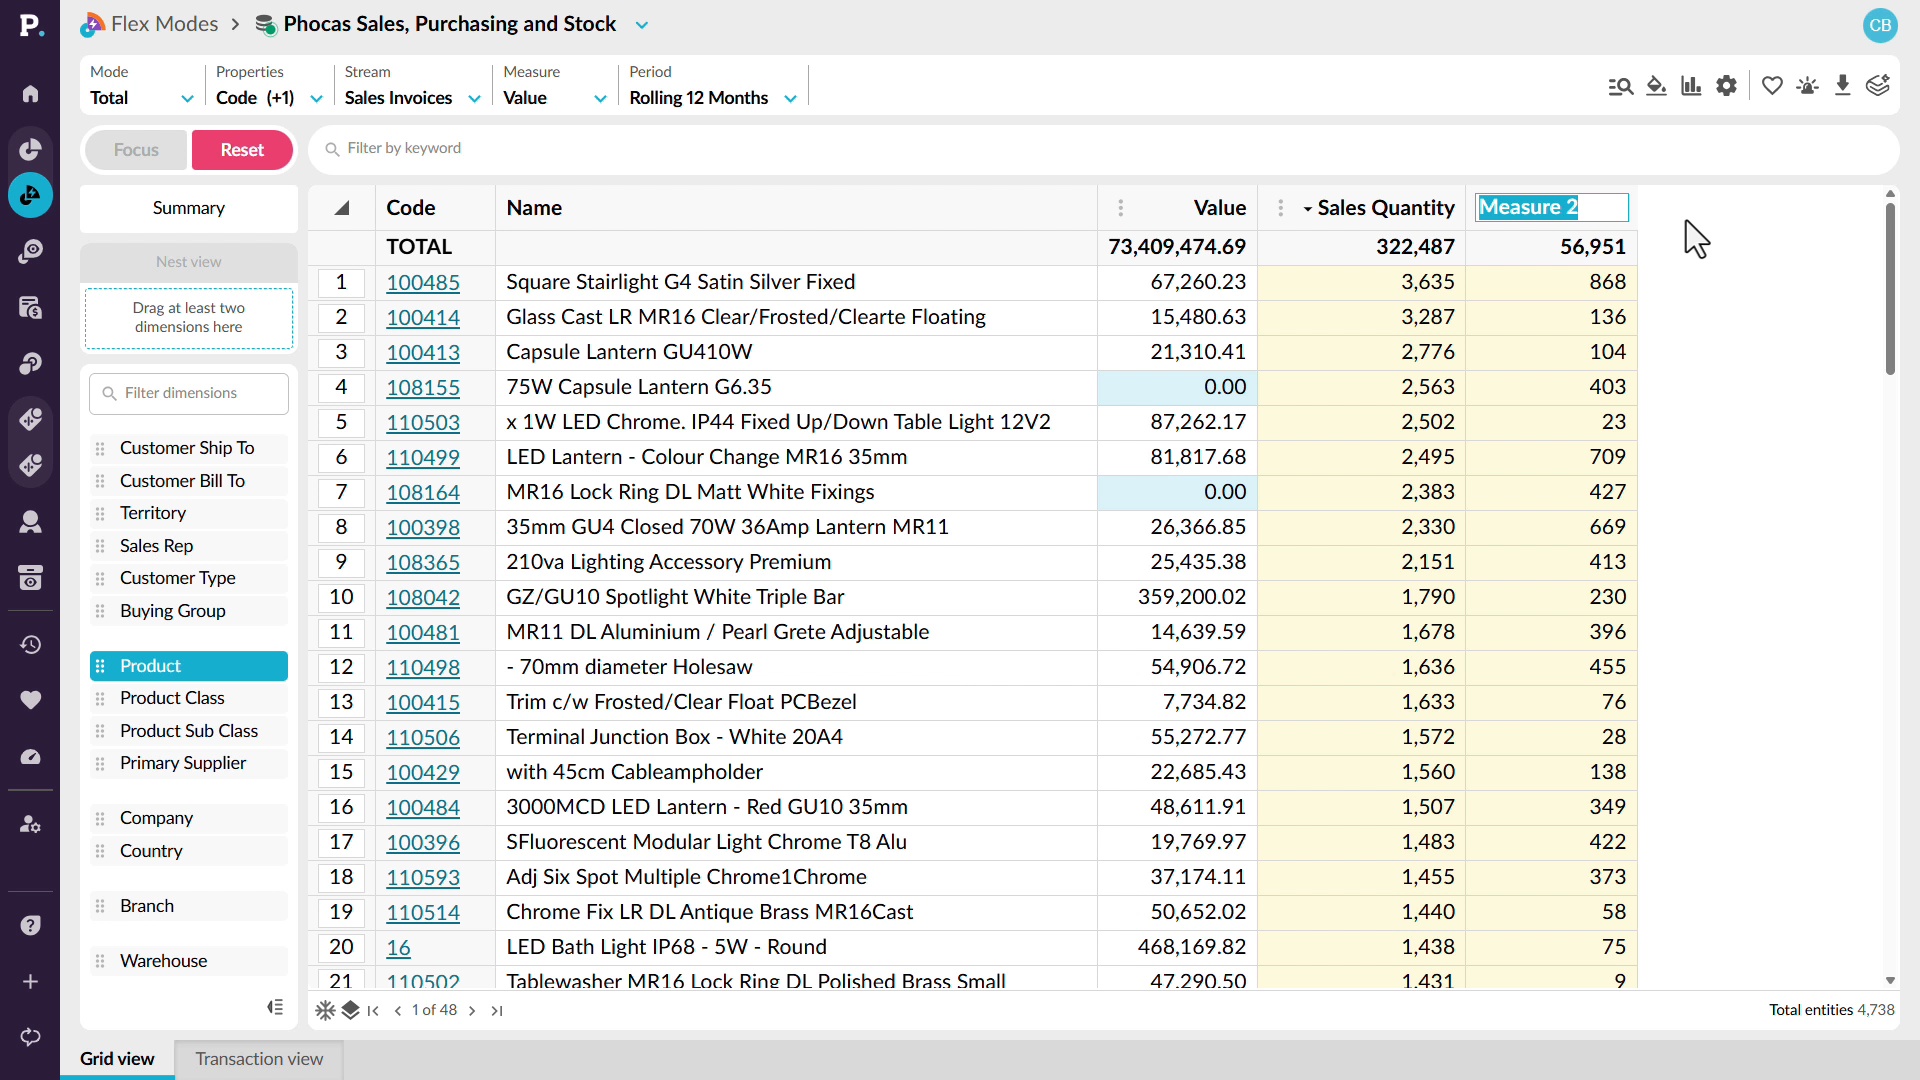
Know your weeks of cover
Learn how to work out your forward stock position by bringing sales quantity and stock on hand into one grid and building calculations that reference other columns, such as average monthly sales. You can duplicate a calculation to compare other periods, then save, send, or download the report, which updates as ERP data refreshes.
 Analytics
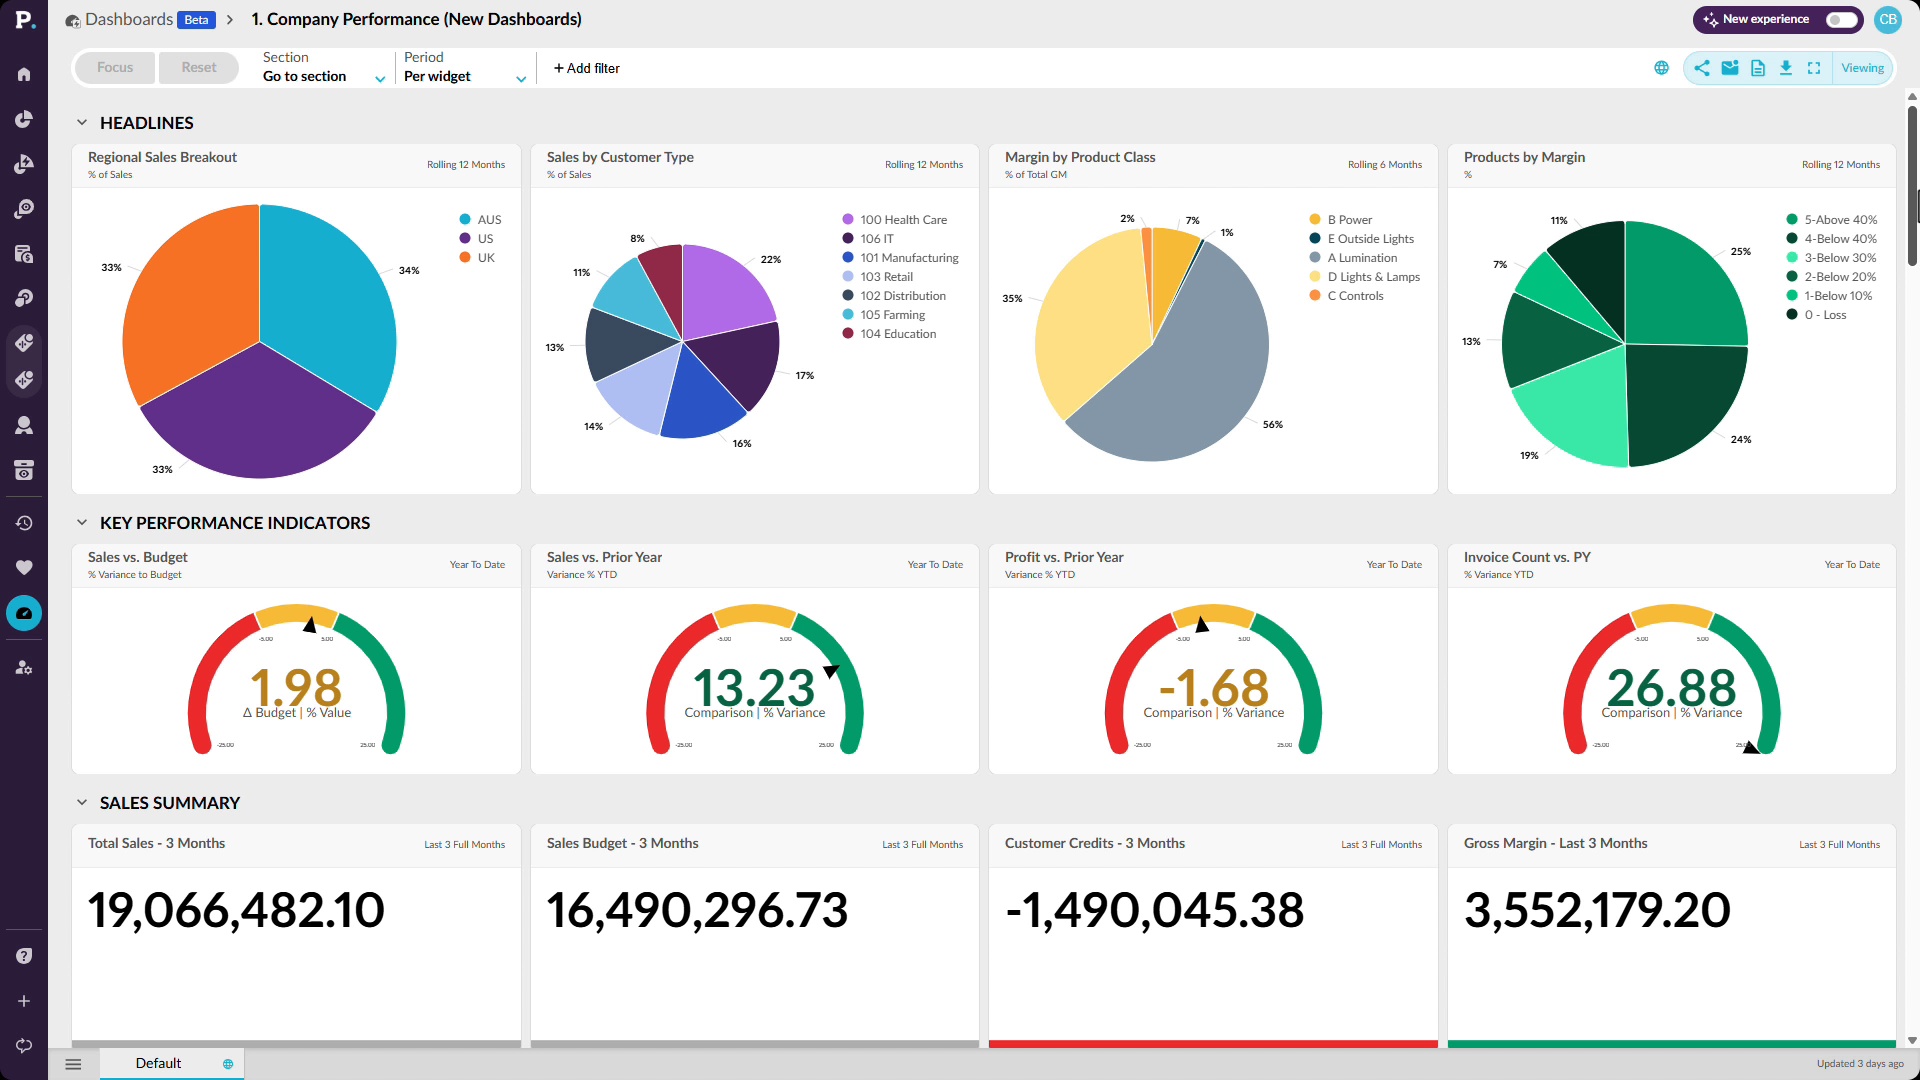
Walk in already briefed
Learn how to prepare for a review by pulling the numbers yourself from live data. You'll use a company performance dashboard that brings sales, profitability, and finance KPIs together, focus it on a region, add filters such as product class, and drill into the data behind any concerning result.
 Analytics
Stop waiting on an answer
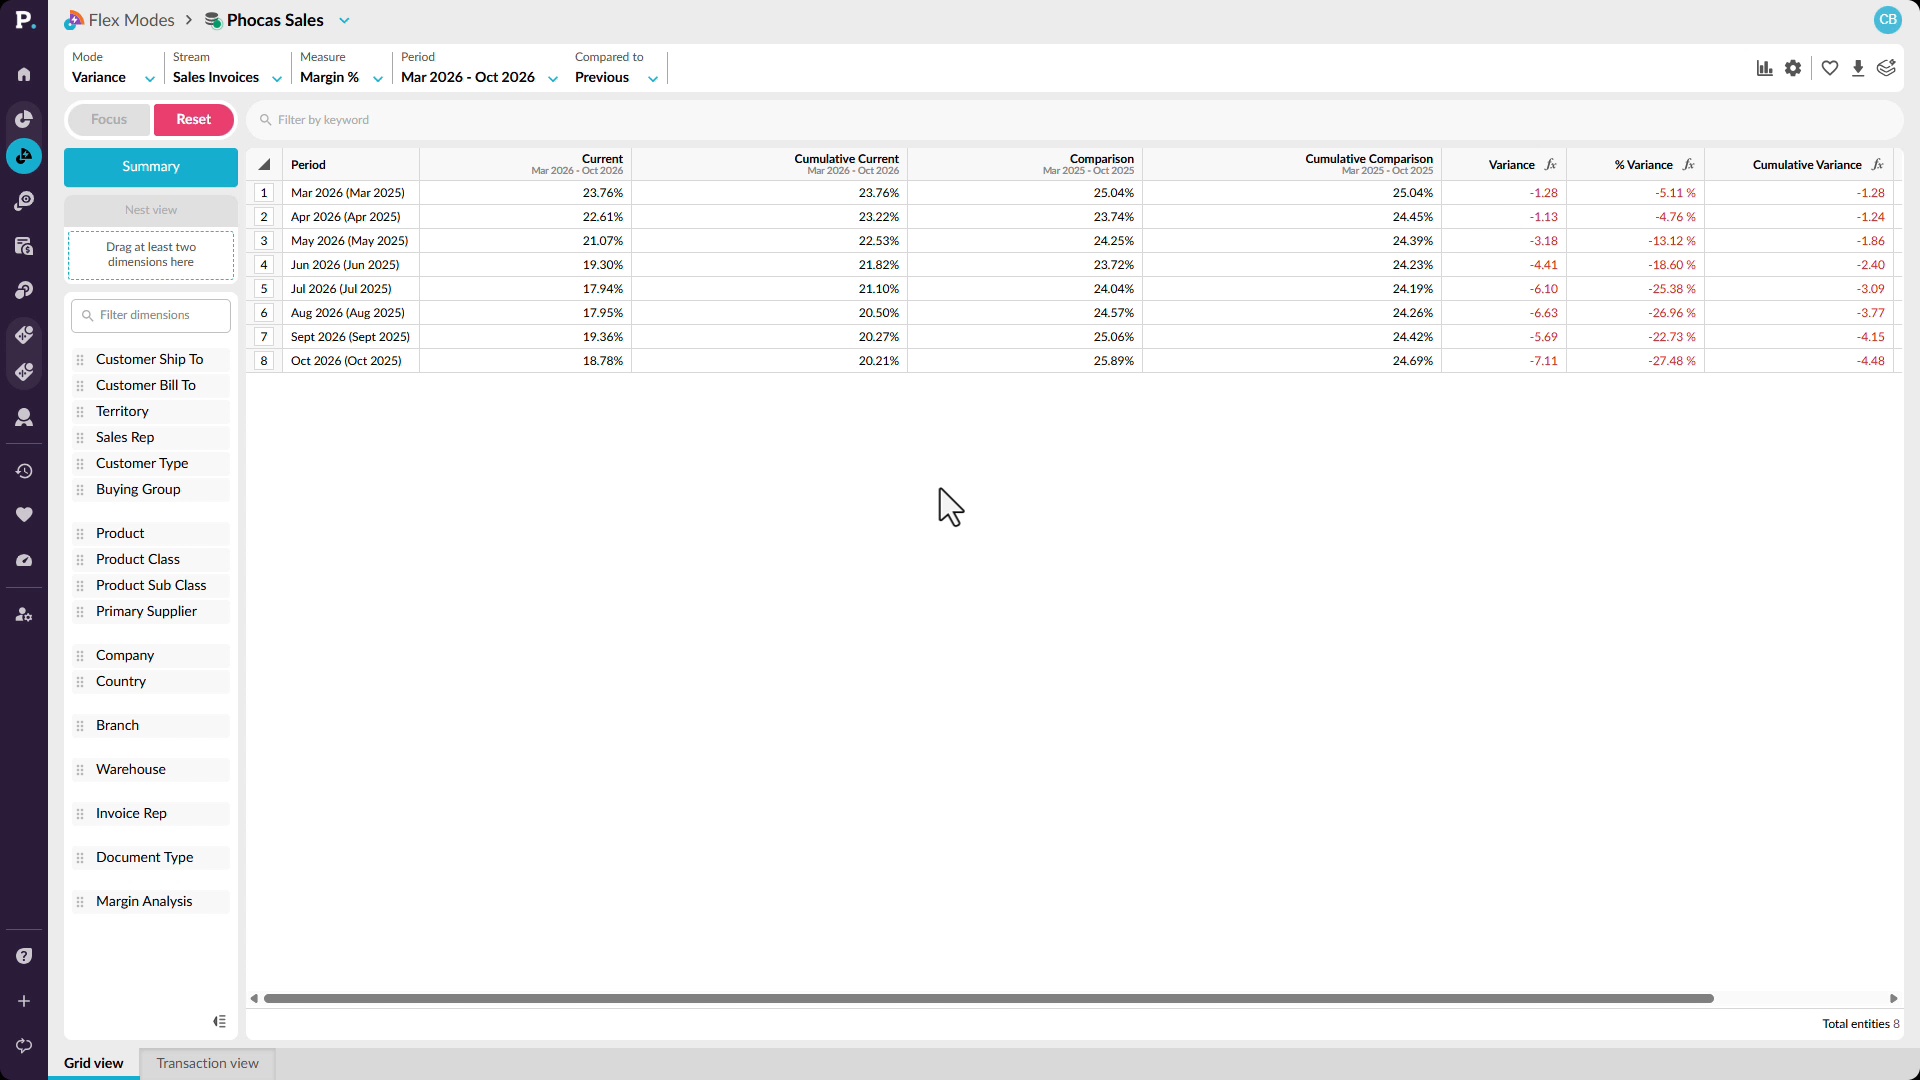
Learn how to answer why margin is down without waiting days for a report. You'll compare margin percentage against the prior rolling 12 months, narrow to the months declining, identify the customers driving the negative variance, and drill to transaction-level detail such as salespeople and products.
 Analytics
See the whole business, not a slice
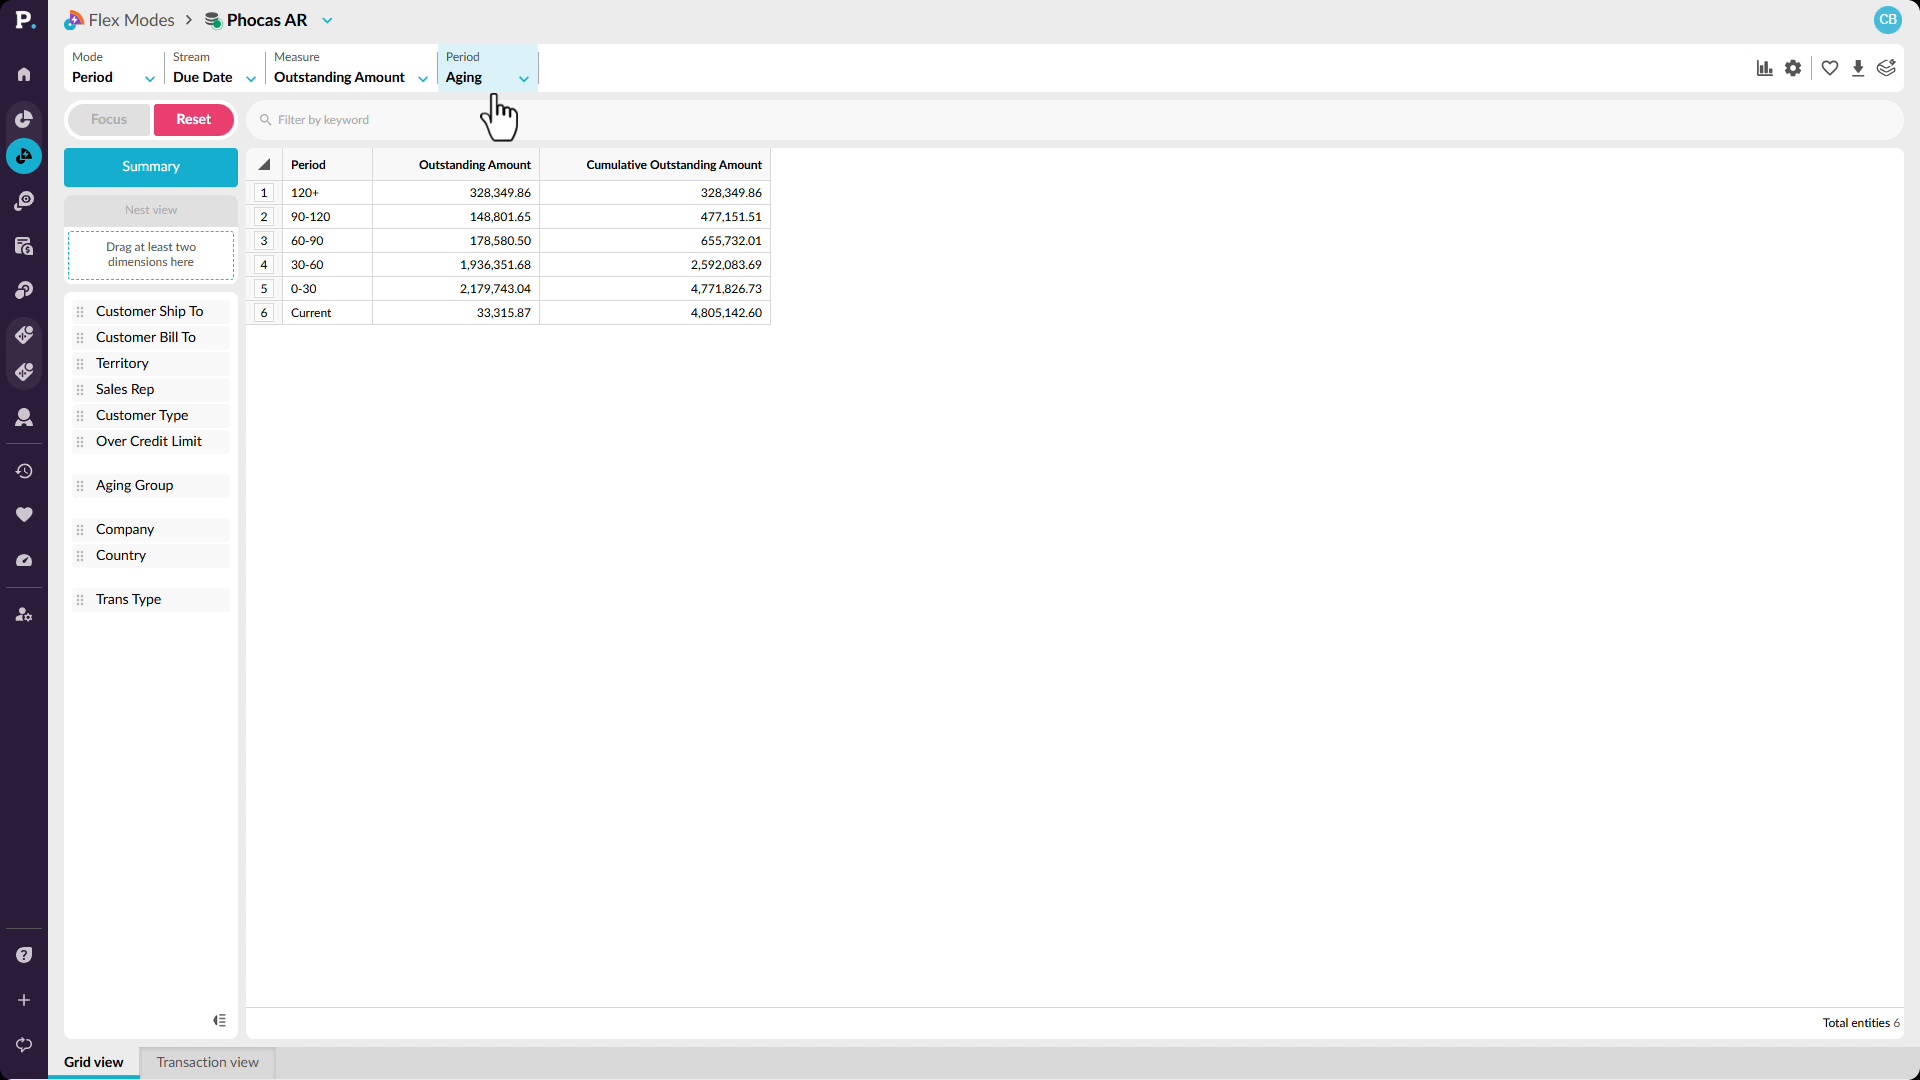
Learn how to spot receivables risk across your whole business before it reaches the monthly pack. You'll start with outstanding amounts in aging buckets, compare them by company, focus on the oldest bucket for one entity, and filter to the customers with amounts outstanding there.
 Analytics
Find where the value really is
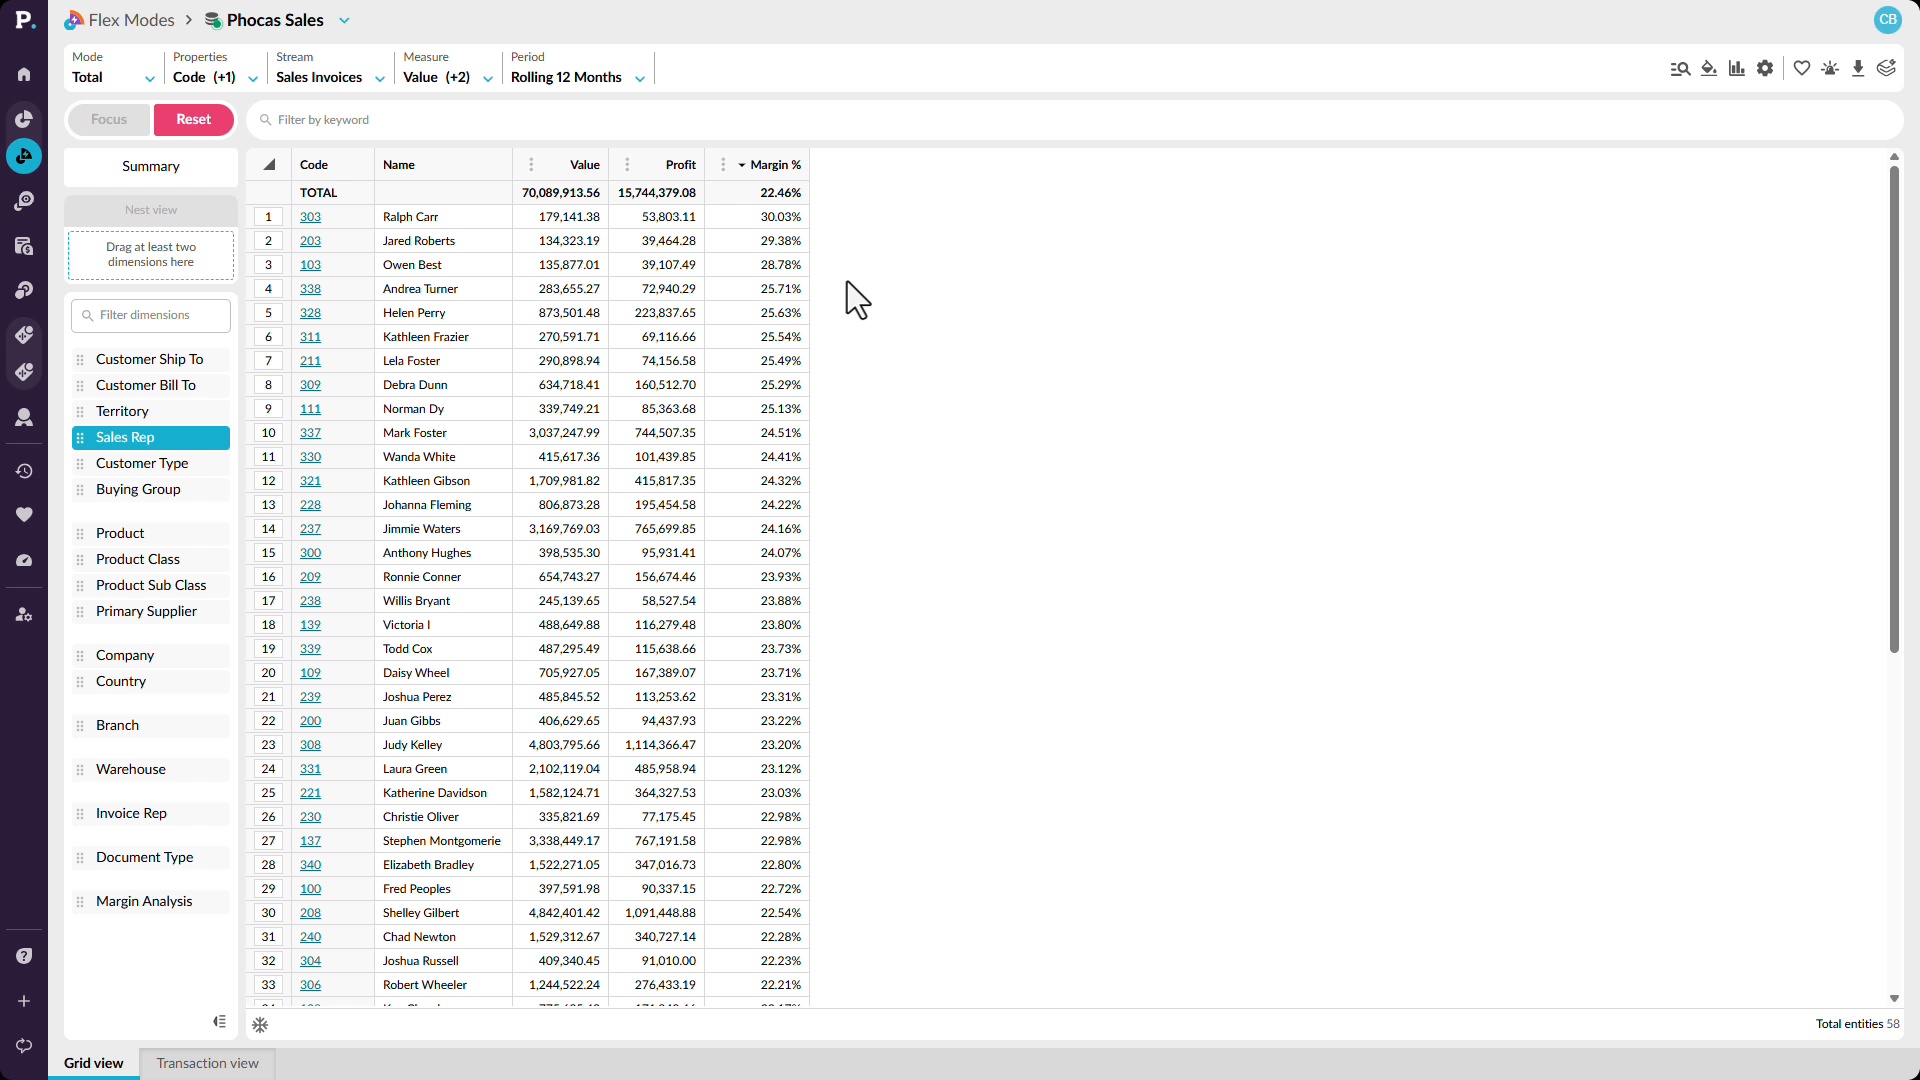
Learn how to tell your biggest customers and sellers apart from your most profitable ones. You'll add profit and margin percentage to a sales view, break the trend out by sales rep, and drill into product categories to find the items that are costing you margin.
 Analytics
Chase the numbers down yourself
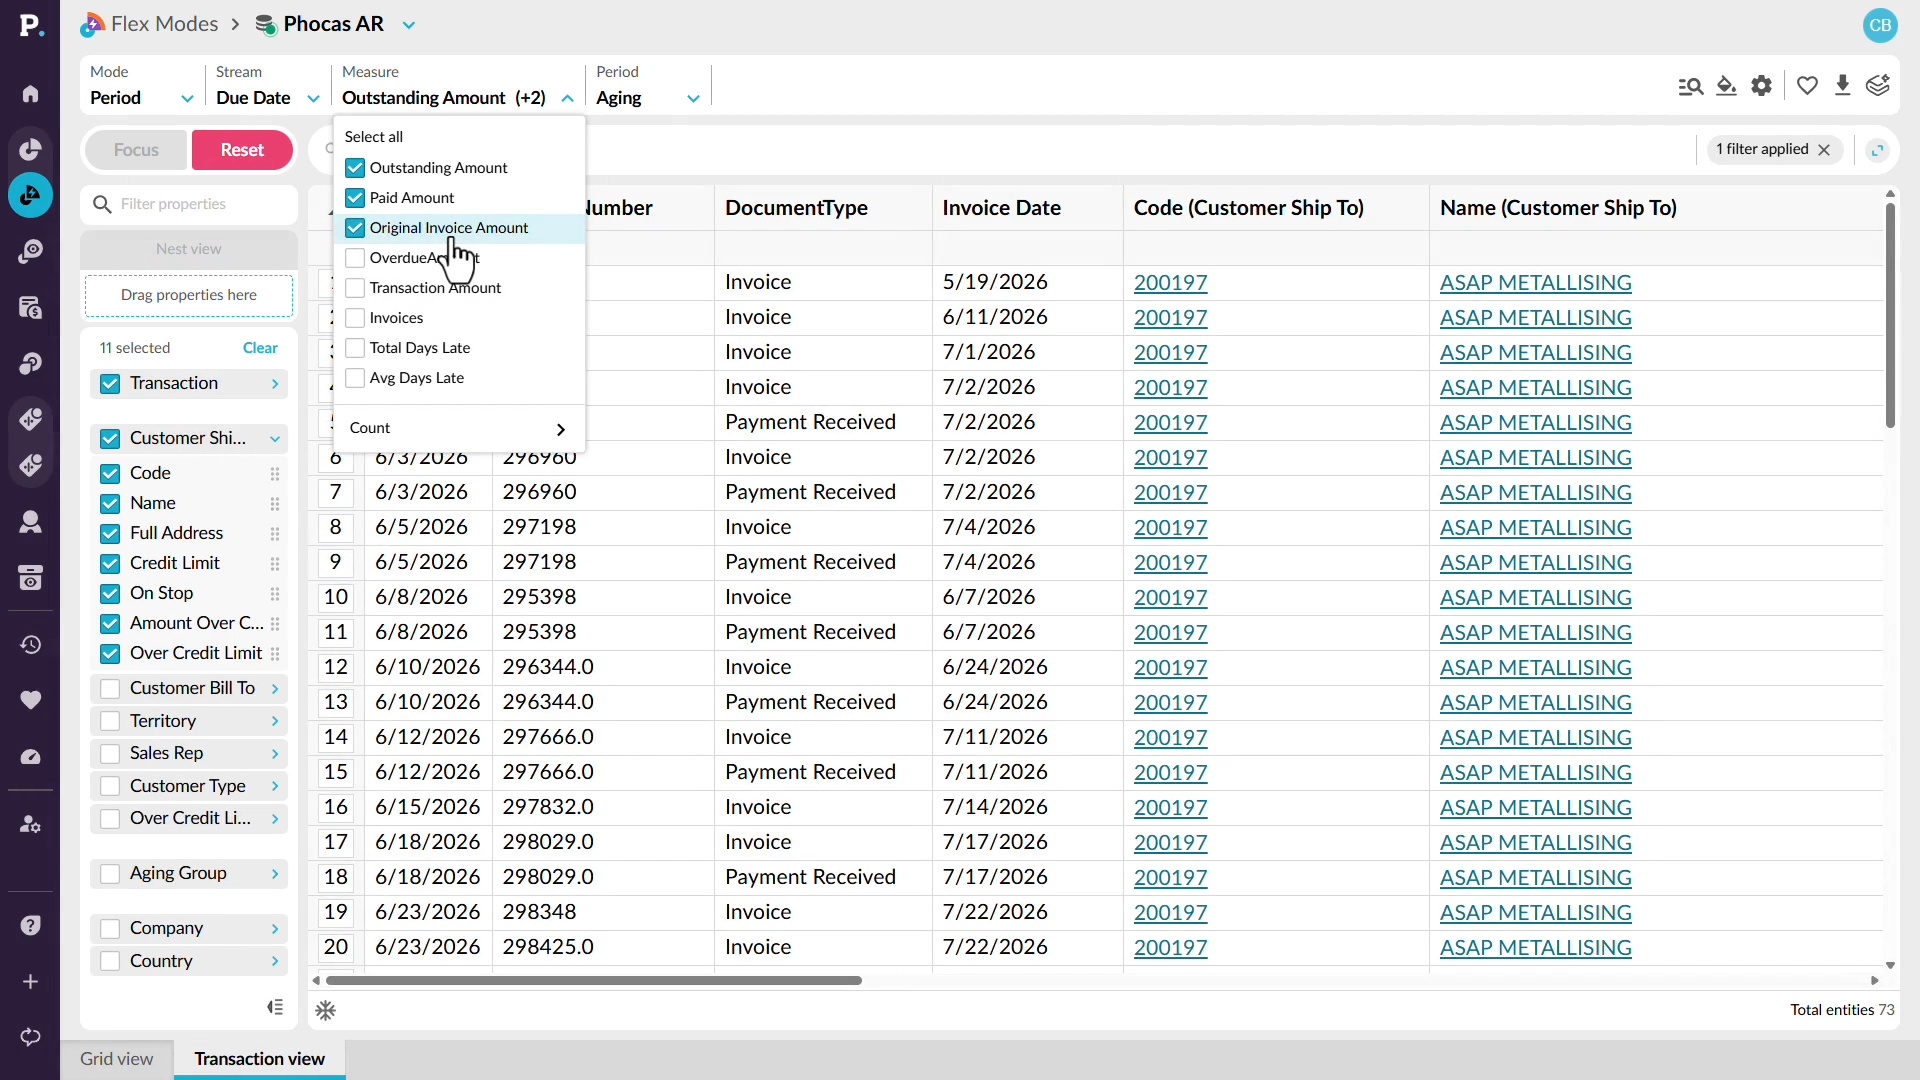
Learn how to find which customers drive your outstanding receivables without waiting on other teams. You'll switch to an aging period, sort customers to find the highest balance, then drill down to the transactions behind it, including payments, credit limits, and original invoiced amounts.
 Analytics
Use alerts
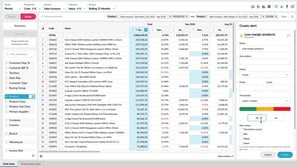
Learn how to monitor important results with alerts. You'll set the metric and red, yellow, and green thresholds, choose when you're notified, and set up email delivery. You'll also test an alert before creating it, subscribe to shared alerts, and restore deleted alerts within 45 days.
 Analytics
View transactions
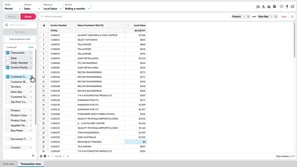
Learn how to see the individual records behind your results, such as invoices. You'll compare Transaction view and Transaction mode, choose transaction and dimension properties as columns, nest by invoice number, search, filter, and add calculations to dig deeper.
 Analytics
Copy or export data
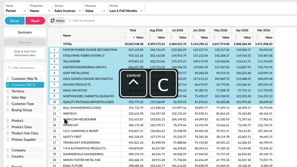
Learn how to take data out of the grid and use it elsewhere. You'll copy selected cells into Excel or Google Sheets, or export a wider set as CSV or XLSX. XLSX exports keep conditional formatting and nested rows, so your view carries across.
 Analytics
Switch modes
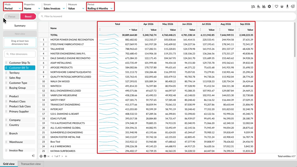
Learn how to change how data appears in the grid by switching between Period, Variance, Stream, Total, and Transaction modes. You'll also move between Summary and Dimension views, and see how your selections and filters carry across, so you can compare the same analysis in different ways.
 Analytics
Change the period
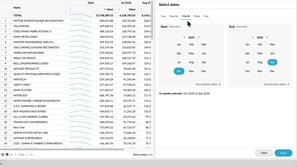
Learn how to change the period so you can focus on the time frame you want to review. You'll choose from available periods, select a fixed date range, and save a user-defined period with dynamic dates, so it keeps showing the latest months without you recreating it.
 Analytics
Manage grid settings
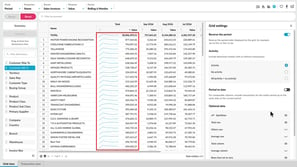
Learn how to tailor the grid with grid settings. You'll reverse the period order, show items with or without activity, align incomplete periods with Period to Date, and add sparklines, totals, and an Others row. You'll also see how to handle rows that net to zero and change the font size.
 Analytics
Save and share favorites
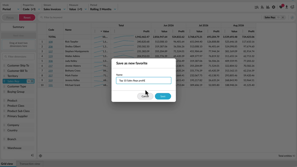
Learn how to save an analysis view as a favorite so you can return to it without setting everything up again. You'll see how to save, update, and delete favorites, share them with other users, save a copy as a new favorite, and subscribe to receive one by email on a schedule.
 Analytics
Work with the grid
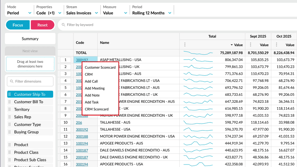
Learn how to work efficiently with the grid. You'll sort values, collapse the dimensions panel for more room, freeze property columns while you scroll, page through large result sets, and select values to see their average, count, and sum. You'll also use right-click actions and keyboard shortcuts.
 Sales Insights
Set up a database
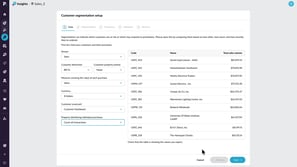
Learn how to configure a sales database as an administrator so you can use customer segmentation in Sales Insights. You select the sales transaction data, customer dimension, and sales value measure, choose five or 10 customer groups, and review the suggested frequency, monetary, and recency thresholds, which you can adjust to suit your business.
 CRM
Create activities with AI voice
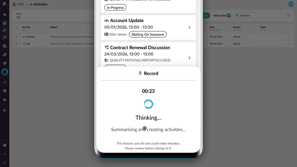
Learn how to use AI voice generated activities in CRM to capture customer updates by speaking instead of typing. You record your update, review the transcription and the activities Phocas suggests, such as a meeting, business note, or follow-up task, then edit them, clear any you don't want, and add them to CRM on desktop or mobile.
 CRM
Use pipelines to track sales progress
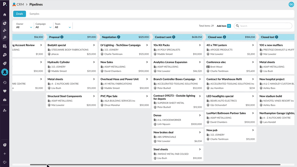
Learn how to track deals, bids, quotes, projects, and other sales items as they move through the stages of a CRM pipeline. Switch between pipelines, filter the board by owner, campaign, or team, and search for items. Add new items, update their details, drag cards between stages, and log activities such as meetings, phone logs, and tasks to keep the pipeline current.

 Financial Statements
Edit a financial statement
Learn how to edit a financial statement so its layout and formatting match your reporting needs. You'll add groups and calculations such as gross margin, arrange rows, apply formatting and performance indicators, choose the revenue row for percent revenue analysis, and build the database so your changes take effect.
 Analytics
Add and manage columns
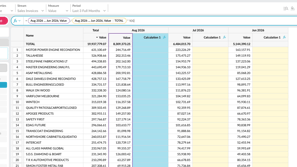
Learn how to shape the grid around your analysis by adding calculation and measure columns, applying number formats, and checking formulas in the FX bar. You'll also see how to resize, hide, duplicate, or delete columns, and save the view as a favorite to keep your changes.
 Financial Statements
Create a budget from within financial statements
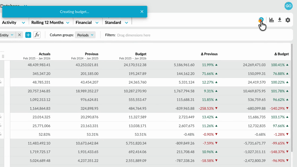
Learn how to create a profit and loss budget directly from your financial statement with one click budgeting, available with the Budgets and Forecasts module. You'll set up the statement levels, create the budget, and open a workbook that reflects your setup, which cuts setup time and keeps both modules aligned.
 Sales Insights
Edit threshold sets for specific customer groups
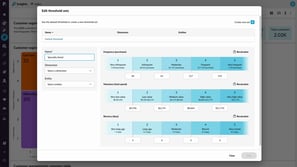
Learn how to tailor segmentation thresholds for different parts of your business by creating a threshold set from the configuration bar menu. You name the set, define the filter criteria that trigger it, and enter the threshold values to apply. When your selected filters match, the segmentation grid updates automatically, and the default thresholds apply when they don't.
 Sales Insights
Create CRM tasks from customer segments
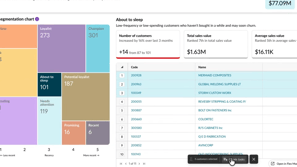
Learn how to turn a customer segment into follow-up work by selecting customers from the grid and choosing Create CRM Activities. You choose the activity type, fill in details such as subject, owner, dates, campaign, and status, and then review the new tasks in the CRM activities list, where each one includes summary context from Sales Insights.
 Sales Insights
Exclude customers from Sales Insights calculations
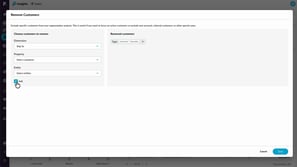
Learn how to exclude customers from all Sales Insights calculations by defining remove customers rules, as an administrator, using any available dimension or by selecting individual customers. Unlike filtering, removal takes customers out of the underlying data, so your customer count, revenue, and segmentation update once you save, and you can adjust the exclusions at any time.
 Sales Insights
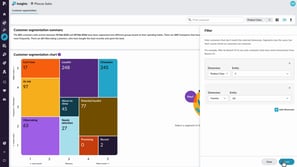
Filter and resegment customers
Learn how to narrow the customer segmentation chart with filters, such as product class or country, while customers keep their original segments. You also learn how to resegment, which recalculates the segmentation using only your selected data so customers can be classified differently, and how combining both helps you spot opportunities and manage risk.
 Financial Statements
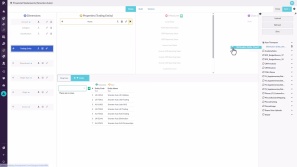
Set up elimination journals
Learn how to set up and post elimination journals in Financial Statements. You'll create an elimination entity, make elimination-only accounts journal-ready, and post a balanced journal in Data Entry. Eliminations sit in their own stream, so you can report on actuals alone or with eliminations and keep a clear audit trail.
 Rebates
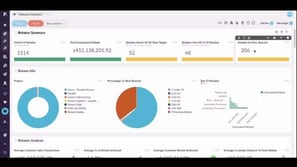
Analyze rebates using dashboards
Learn how to use dashboards that draw on the rebates analysis and near miss analysis databases to track total rebates, brackets achieved, top performing rebates, and where surplus is likely to surface. You also learn how to see margin impact before and after rebates, and how to share a dashboard with a customer using a viewer license.
 Rebates
Analyze near-miss rebates
Learn how to analyze the near miss analysis database in Rebates, which acts like a return on investment gauge for rebate cycles. You add measures such as bracket achieved, distance to the next bracket, and likely rebate, then slice the data by supplier or customer to see how much more you need to spend to earn the next payout.
 Rebates
Analyze rebate performance
Learn how to use the rebates analysis and near miss analysis databases to see where rebate amounts are paid out by rule, bracket, or agreement, and which customers or suppliers they're based on. You also learn how to visualize the results, add them to a dashboard, and, as a customization, blend rebates into your sales data to compare value and profit before and after rebates.
 Analytics
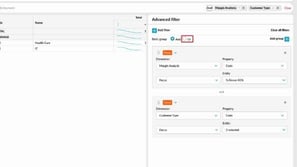
Create advanced filters
Learn how to answer more complex questions with advanced filters. You'll build rules from condition, focus or exclude, and keyword types, combine them with and or or logic, and group rules to create more precise queries. You'll also see how to remove rules or clear all filters.
 Platform
Get started as a Viewer
Learn how to use a Viewer license, which is designed for people who need to view information rather than analyze it. On the Phocas homepage, you can see dashboards, favorites, and alerts shared with you, use basic filters, and set one as your default view. You also learn what a Viewer can't do, and that upgrading to a full license is a request for your administrator.
 Financial Statements
Find your intercompany journals
Learn how to find intercompany journals in Financial Statements by opening the Data Entry tab on the homepage. You'll see which permission you need and how to view existing journals, continue drafts, create new ones, filter by keyword, and delete journals that are still in draft status.
 Financial Statements
Create an intercompany journal
Learn how to create an intercompany journal from a financial statement or the Data Entry tab, then enter balanced debit and credit lines against an elimination entity. You'll add descriptions, save the journal as a draft to keep editing, and publish it when you're ready to make it final.
 Sales Insights
Get started with Sales Insights
Learn how to read the customer segmentation chart, which groups customers into ten segments based on recency, frequency, and monetary value, such as champions, can't lose, and hibernating. You also learn how to open a segment for more detail, search, filter, resegment, and export customers, create CRM tasks with a CRM license, and open a segment in Analytics.
 Budgets & Forecasts
Add detail to your budget
Learn how to add detail when changing the budget setup isn't practical, by adding database or balance sheet tabs and new rows on the main tab. You'll see how a database tab drives values into the main tab, how a balance sheet tab adds a cash flow tab for a three statement model, and how to add accounts or entities.
 Budgets & Forecasts
Set up comparison rows
Learn how to configure comparison rows that appear beneath each budget row, starting from the default of last year's actuals. You'll change the stream, measure, and offset, add more comparison rows, apply custom formatting, and see how contributors can show or hide them while variance percentages update as they edit.
 Budgets & Forecasts
Manage the workflow
Learn how to assign rows to contributors individually or in bulk, review submitted work, and accept or reject it with comments. You'll also learn how to mark rows complete, how administrators can self assign or step in, and how to revert a row to baseline, which can't be undone.
 Budgets & Forecasts
Publish a budget
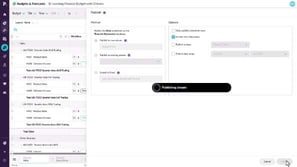
Learn how to publish a budget from an output tab by creating a new stream, publishing to an existing stream, or exporting to Excel. You'll also learn which options control what gets published, such as completed rows only, zero-value rows, and a date range, and how to open the published data afterward.
 Budgets & Forecasts
Create a budget workbook
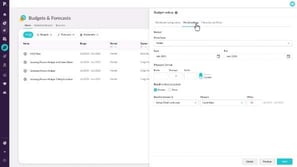
Learn how to create a budget workbook by naming it, choosing a database, setting the budget period, and deciding how to populate it, for example with last year's actuals or all zeros. You'll also review hierarchy settings, see why to finalize the setup before budgeting begins, and manage access and permissions for administrators.
 Analytics
Create a nested view
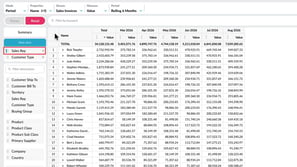
Learn how to build a nested view by dragging up to six dimensions into the nest view box, so you can expand each level to see how detail contributes to the overall result. You'll also see how to reorder or remove levels and add another dimension for more detail.
 Analytics
Take a tour of Analytics
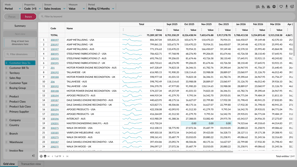
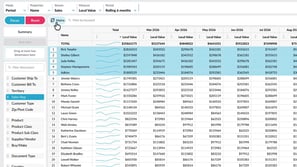
Learn how to find your way around Analytics and shape your view to answer the question you have. You'll see how the toolbar, dimensions panel, filter bar, and grid work together, and how to focus on data, filter it, nest dimensions, and open the transactions behind a result.
 Analytics
Compare data in a matrix
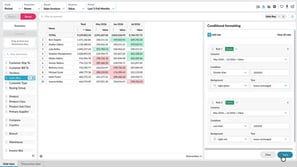
Learn how to compare data across two dimensions in a matrix, such as sales reps across customer types. You'll select the rows to compare, add a second dimension, and use focus and conditional formatting to refine the view. Pivot the matrix to switch rows and columns without rebuilding it.
 Analytics
Apply conditional formatting
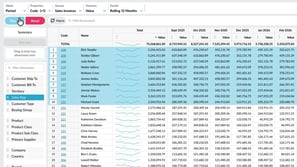
Learn how to highlight key values in the grid with color-based rules, so trends and outliers stand out without sorting or filtering. You'll set conditions such as greater than or less than, choose background colors, and edit or remove rules. Conditional formatting is saved with favorites and carries over when you export to Excel.
 Analytics
Filter data
Learn how to narrow the grid to the rows that matter. You'll focus on specific items, exclude data you don't need, search for matching values, and apply conditions such as greater than from the right-click menu. You'll also see how filter tags work, and how to remove one filter, clear them all, or reset.
 Budgets & Forecasts
Use sum and working lines
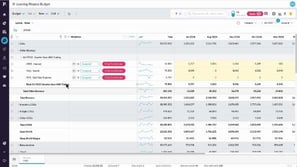
Learn how to add sum lines to break a budget row into detail, such as office supply costs by building, and how to fill months with copy forward or spread evenly. You'll also learn how to add a working line that calculates bad debts as a percentage of sales revenue using an Excel-style formula.
 Budgets & Forecasts
Take a tour of Budgets & Forecasts
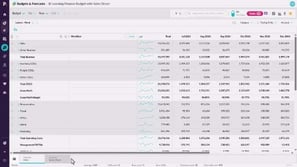
Learn how to open Budgets and Forecasts from the Phocas menu, find the workbook you need, and move between its worksheet tabs. You'll see how editable rows, the workflow column, and the tasks panel support collaboration, and how a finished workbook can be finalized, exported, or published with full traceability.
 Budgets & Forecasts
Access the budget and your tasks
Learn how to find the budget or forecast rows that an administrator or owner has assigned to you. If email notifications are enabled, you receive a message with a link to sign in to Phocas, and you can then open the worksheet, check your task count, and select an assigned section to begin working.
 Budgets & Forecasts
Change the grid layout
Learn how to expand or collapse rows, switch between pruned and unpruned views, and use the flat view to see more rows at once. You can also resize the workflow column, hide sparklines in total columns, and group columns into periods such as fortnights or quarters to make data entry easier.
 Budgets & Forecasts
Edit values in a worksheet
Learn how to work in the yellow rows assigned to you, spreading a total across the period or basing values on other data, such as increasing last year's actuals by five percent. You can add comments and links to cells so your team can collaborate, then submit a finished section through the workflow so the owner can approve it.
 Budgets & Forecasts
Filter the data
Learn how to narrow the data in a worksheet using the all or my tasks toggle, keyword search with wildcards, and condition filters that use rules on specific columns. You can also filter by dimension, reorder dimensions, switch to tab view to work through entities one at a time, and save some of these settings as a layout.
 Budgets & Forecasts
Use formulas
Learn how to build calculations by typing an equals sign in a cell or the formula bar. You can reference cells in the same row, the comparison row, or another worksheet, use standard functions, copy a formula forward, and lock a reference with the F4 key, for example to base technology costs on a percentage of salary.
 CRM
Integrate your Microsoft 365 Outlook calendar
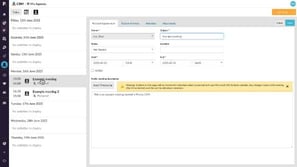
Learn how to connect your Microsoft 365 Outlook calendar from your account settings so CRM meetings appear in Outlook automatically. Create a personal appointment in CRM and see edits carry over between Outlook and CRM in both directions. Meetings you create in Outlook also appear as CRM activities, recorded as a meeting when attendees match a CRM contact linked to an account.
 Financial Statements
Budget by region and branch
Learn how to create a budget at the regional and branch level using Financial Statements and Budgets and Forecasts together. You'll set up levels and a budget period, assign sections to region and branch managers, and review, approve, and submit their budgets through to the admin.
 Analytics (Classic)
Narrow your search by entity or property
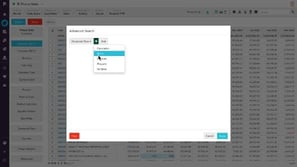
Learn how to use simple Advanced Search rules to cut your data down to what matters. You'll combine entity rules, such as including or excluding values on different dimensions, and add a property rule to list customers within a ZIP or postal code range before further analysis.
 Analytics (Classic)
Use custom mode to show target performance
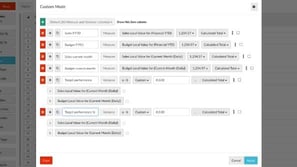
Learn how to add and define your own columns in Custom mode, including choosing the stream, measure, and period for each one. You'll clone columns to save time, add variance columns that compare sales to budget as a value or percentage, and format column values with a prefix, suffix, decimal places, or thousand separators.
 Analytics (Classic)
Add your own defined period
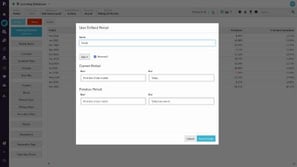
Learn how to add a user defined period from the Period menu by choosing a period type, setting start and end points for the current and previous periods, and naming it. Build a month to date period with special start and end points, or a dynamic calendar year to date period that updates each year. You can edit or delete saved periods later, with the right permissions needed to create them.
 Analytics (Classic)
Apply a custom period
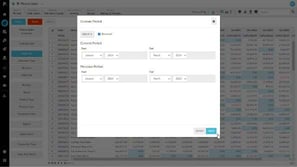
Learn how to set a custom period by choosing a time unit, deciding whether the grid shows the most recent data first, and picking start and end dates for the current period. The previous period updates to one year earlier automatically, and you can change it if needed. Once applied, the grid shows the data for that temporary date range, with the range displayed in the status bar.
 Analytics (Classic)
Sort and summarize your data
Learn how to use the summary view beyond the start of your analysis, for example by narrowing it to selected product classes and changing the date range in the periods menu. You'll also see how turning customer properties on and off summarizes customers by a property such as suburb, so you can focus on one item and continue your investigation.
 Analytics (Classic)
Create KPI-style gauge, summary and bullet charts
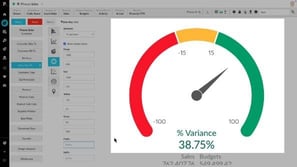
Learn how to create KPI-style charts in chart view, including a gauge showing percentage variance against budget, a summary that counts declining customers, and a bullet chart comparing territories to the previous period. You'll set color ranges and conditions, then save the charts as favorites, set them as alerts, or add them to a dashboard.
 Analytics (Classic)
Use Matrix Variance and Matrix Share mode
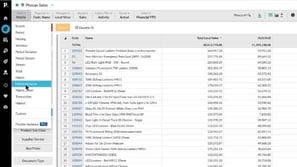
Learn how to build on Matrix mode with Matrix variance, which adds previous period and variance columns, and Matrix share, which shows each row as a percentage split. You'll also learn how to simplify matrix column headings with matrix captions, and how to sort the share results to find customers who buy fewer of one item than expected.
 CRM
View and update accounts in CRM
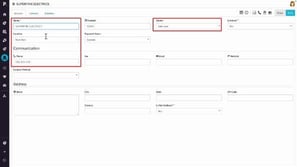
Learn how to view and update customer accounts in Phocas CRM, using filters and search to find them. Change an account's owner, manage its contacts and primary contact, and review its activities. Open the account's record in Phocas Analytics for sales history and trends, and create a new account manually, where only a name is mandatory.
 CRM
Manage campaigns
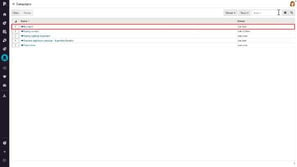
Learn how to manage campaigns in Phocas CRM, such as seasonal promotions or product launches that span activities across multiple accounts, contacts, and leads. Filter by owner or team, search by name, and open a campaign to update its name and owner. You can also review its activities in one place and create a new campaign, assigning another owner if needed.
 CRM
Add an activity
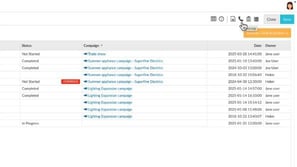
Learn how to document customer activities in CRM by adding a business note, meeting, phone log, or task to an account, contact, or lead, including subject, campaign, dates, description, and attachments. You also learn how to filter, search, and sort the main activities screen and switch between list, calendar, and agenda views.
 Financial Statements
Add a financial statement
Learn how to add a new financial statement in Financial Statements, either from scratch or by duplicating an existing one. You'll choose the statement type, name it, and create or reuse an account mapping. Duplicating copies the structure and mappings, so you can make changes without affecting the original.
 Financial Statements
View and explore dashboards
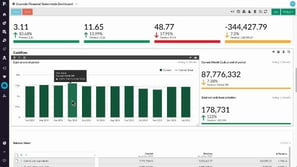
Learn how to view and explore a Financial Statements dashboard. You'll focus on a specific entity, reset the view, hover over charts for tooltips, and analyze data to continue your investigation in the statement. You'll also set a home dashboard, subscribe to email updates, and find your dashboards.
 Administration
Monitor user activity
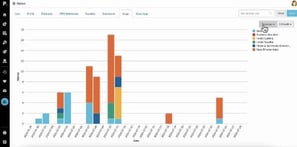
Learn how to track user activity from the Users section in administration, where each user's Usage tab shows which databases they use, how many queries they run, and when. You can spot low usage users to offer extra training, and with detailed logs turned on in their settings, the Query logs tab records their queries, clicks, and exports.
 Administration
Manage default database restrictions
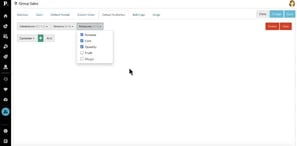
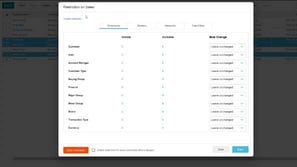
Learn how to set default restrictions that control which data people can see in a database. You choose which dimensions, streams, or measures to restrict, for example deselecting Profit and Margin in the Group sales database, and that becomes the default access when no other restrictions are set. The Databases list then shows the restriction applied.
 Analytics (Classic)
Change the mode
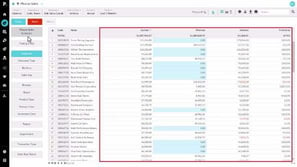
Learn how modes work as predefined views that show particular columns in the grid. Switch from the default period mode to Variance to compare current and previous period performance side by side, or isolate a customer and use Transaction mode to see the individual transactions behind their results. Some modes, such as Variance, are only available when a dimension is selected and you're in a filtered view.
 Financial Statements
Manage streams and scenarios
Learn how to use Manage Streams and Scenarios, also known as Combined Streams, to control which data appears in your statements. You'll set the default stream order for all users, create a scenario that combines streams such as actuals and allocations, and hide streams you rarely use.
 Financial Statements
Map accounts to a group
Learn how to map accounts to groups in Financial Statements so each account appears in the correct section of your statement. You'll search, filter, and sort the account list, map several accounts at once, hide mapped accounts, and rebuild the database to apply your changes.
 Financial Statements
Set up your Trial Balance statement
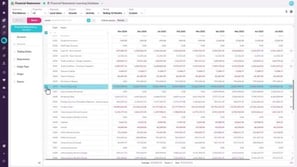
Learn how to set a financial year end date so your Trial Balance shows the right closing balances. Profit and Loss accounts show the balance since the start of the year, while retained earnings exclude current-year movements. You can also add levels or column groups to see each trading entity.
 Analytics (Classic)
Perform an advanced search
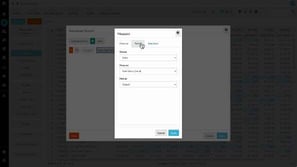
Learn how to go beyond the basic search box with Advanced Search, starting with its five rule types. You'll build a measure rule to find customers above a sales threshold over a rolling period, then clone and adjust calculation rules to compare monthly averages and spot declining customers.
 Financial Statements
Customize columns
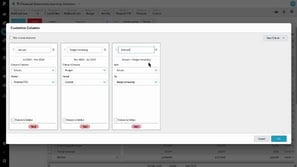
Learn how to add, rename, and hide total, sum, and variance columns, each with its own data stream and period. For example, combine actuals with the remaining budget to build a forecast, then compare it with your full-year budget. Save the result as a custom layout, favorite, or dashboard item.
 Budgets & Forecasts
Create a budget
Learn how to set up a financial budget from the Budgets and Forecasts homepage. You name the budget, choose the database and a template such as profit and loss, set the period type and dates, and pick a baseline like prior year actuals or zero. You then add up to four budgeting levels, such as trading entity and department.
 Financial Statements
Apply a custom period (Financial Statements)
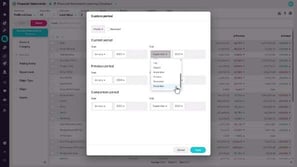
Learn how to set a temporary date range by choosing a time unit, start and end dates, and the order of your columns. The previous and comparison periods update automatically, and you can adjust them before you apply the period to your grid.
 Financial Statements
Copy or export financial information
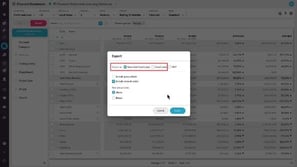
Learn how to choose export options such as account codes, formulas, and row group totals, then create an Excel or PDF file for reporting or further analysis. You can also copy selected data and paste it into another application, so you can use part of a statement without exporting it.
 Financial Statements
View transactions (Financial Statements)
Learn how to drill down from a value in your financial statement to the transactions that make it up. Transactions are the most granular level of detail in the database, so they help you investigate the root cause of anomalies. Use the Analytics tools to examine them further, then return to the statement.
 Financial Statements
Manage statement levels
Learn how to build up to six levels of grouping in your financial statement by adding dimensions such as department and branch. Filter each level to specific entities, rearrange the hierarchy, and expand calculation rows to see a breakdown by dimension.
 Financial Statements
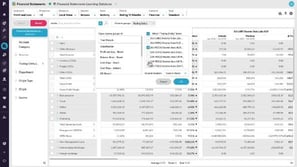
View financial information in a matrix (change column groups)
Learn how to turn the statement grid into a matrix by dragging a dimension, such as branch, into the column groups area. Choose which entities to compare and show only their names in the column headers, so you can scroll across the columns and spot differences in performance quickly.
 Financial Statements
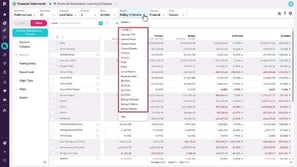
Change the period (Financial Statements)
Learn how to use predefined, custom, and user defined periods to control the date range shown in your financial statements. User defined periods can have fixed or dynamic dates. You can also set a default period for a database, so it's applied automatically each time you open it.
 Financial Statements
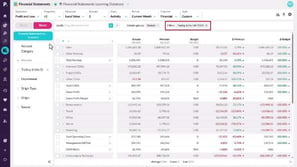
Filter data (Financial Statements)
Learn how to focus your financial statements using the keyword box and dimension filters. Drag dimensions into the filter area to narrow the view, carry filters into Analytics, then remove a single filter or reset to return to the full dataset.
 Analytics (Classic)
Phocas AI
Learn how to get answers from your data by typing a question into Phocas AI, such as finding your best-selling products over a set period. You'll see the grid update with the result, review the steps Phocas AI took, and learn that it can't do anything the grid itself can't.
 Administration
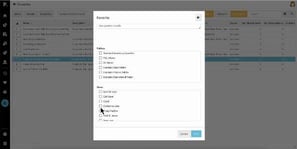
Manage favorites, dashboards, and subscriptions
Learn how to filter the favorites list by database, owner, or folder, then share a favorite with a folder and with individual users who have access to its data. You also learn how to subscribe a user to email notifications that arrive when data changes, and how the Dashboards screen lets you share, subscribe, or delete dashboards the same way.
 Rebates
Configure brackets
Learn how to configure the Brackets section of a rebate rule. You set bracket conditions such as calculation method, calculation type, retrospective, and the basis measure, then define tiers with From, And, and Up To and Including values that reflect either a monetary amount or a unit count, depending on the measure.
 Rebates
Configure retrospective rules
Learn how the retrospective bracket condition affects a rebate rule's results. A rule set to the full amount applies the top bracket percentage to all transactions, while a non-retrospective rule gives each increment the percentage of the bracket it falls into. You compare both calculations in the Results tab to see the difference in the rebate amount.
 Rebates
Configure pro rata rules
Learn how to configure a pro rata rebate rule that forecasts the final rebate amount for a twelve month period at an earlier point in the year. You set the amounts per option to year, set retrospective to yes, choose Linear or Seasonal, and see how calculating through a later month can move the forecast bracket.
 Rebates
Post calculation results
Learn how posting calculation results saves them to your rebates database and locks them for that calculation period so later runs don't overwrite them. Posting doesn't issue a payment or claim or write data to your ERP system. You can post from the rule or in bulk from the Results tab, and a rule with posted results can't be edited or deleted.
 Rebates
Calculate rules
Learn how to calculate a saved rebate rule from the results section of the rule setup. You describe the calculation, enter start and end dates to set which transactions are included, and then review the results. From there, you can post them to your Rebates Analysis database, delete them, or recalculate and overwrite them.
 Rebates
Create a rule (initial setup)
Learn how to start a new rebate rule from the Rules tab of your project. You can create a single rule, create multiple rules based on a database dimension, or reuse settings from a template, then give the rule a unique name, choose its type, set the validation period, select its dimension and entity, and limit it with includes and excludes.
 Rebates
Create a project
Learn how to create a Rebates project from the Rebates Project page and set it up for adding rules. You choose the source database, enable receivable or payable rules, select the stream and the value and quantity measures for your brackets, set calculation and display precision, and optionally assign a group.
 Analytics (Classic)
Find your way around Phocas
Learn how to navigate the menu on the left, where you can open products, recent items, favorites, and dashboards. You'll rearrange, rename, and collapse sections, pin favorites, and find Help and Support and your User Profile menu in the top bar.
 Financial Statements
Use multiple currencies
Learn how to set up currency settings and upload Balance Sheet exchange rates so assets and liabilities convert at a single rate for each point in time. Mark your equity accounts to keep transaction rates, which creates a foreign currency translation reserve.
 Budgets & Forecasts
Contribute to the workflow
Learn how to find the tasks assigned to you from your home page or the tasks button, then enter values in your editable rows. You can assign a row to another user to get their input, submit several tasks at once, review and accept or reject returned work, and unsubmit a task to make changes.
 Financial Statements
Add financial analysis to a dashboard
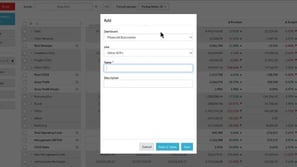
Learn how to add your Financial Statements views to a dashboard as grid snippets or charts. Choose an existing dashboard or create a new one, name the item, and open it to see how it looks. You can then use the analyze shortcut to return to your statement data and monitor performance at a glance.
 Financial Statements
Save and share favorites (Financial Statements)
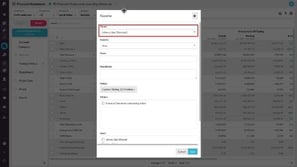
Learn how to save and share favorites in Financial Statements. You adjust a statement, for example by comparing trading companies in a matrix, then save the view with a name, description, and period. You can share it with specific users or folders and reopen it from the favorites menu or homepage.
 Financial Statements
View financial information in a chart
Learn how to use charts to explore and interact with your financial data. You open the chart panel, choose a chart type, adjust the configuration, and use column groups to compare trading entities without scrolling. When you're happy with the chart, you can add it to a dashboard to share.
 Financial Statements
Change the columns
Learn how to change the view of a financial statement with the columns menu. You can remove variance columns for a cleaner grid, break a total into month-by-month periods, or turn on sparklines in the Income Statement to spot trends and anomalies at a glance.
 Financial Statements
Take a tour of Financial Statements
Learn how to open Financial Statements and explore its main areas. You see how the grid shows groups and calculations, how to switch between statements and adjust your view with menus, and how dimensions let you filter and add levels, so you can chart or export your financial data.
 Budgets & Forecasts
Spread totals
Learn how to use the spread options to distribute a total across the budget period, either evenly or in proportion to a comparison stream such as last year's actuals. You'll also learn how to apply a percentage change by row and how to spread totals over multiple rows or higher-level totals at once.
 Budgets & Forecasts
Use comparison rows
Learn how to show comparison rows that display values from another stream, such as last year's actuals, along with the percentage difference as you adjust your budget. You'll also learn several ways to show or hide them, and, if you have access to financial data, how to view the transactions behind a cell's value from the cell menu.
 Analytics (Classic)
Homepage at a glance
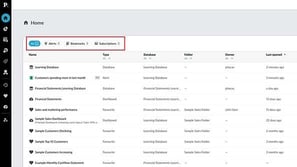
Learn how to find your way around the homepage, from the All, Alerts, Dashboards, Bookmarks, and Subscriptions tabs to search, filters, and sorting. You'll also see how to share, bookmark, or edit items from the row menu and restore deleted items within 45 days.
 Analytics (Classic)
Visualize your data in a chart
Learn how to switch to the chart view, choose from the available charts, and customize them with the configuration options. You'll also see why some charts are unavailable, how to focus on items that interest you and return to the grid, and how to export the chart as an image, save it as a favorite, or add it to a dashboard.
 Analytics (Classic)
Compare data with Matrix mode
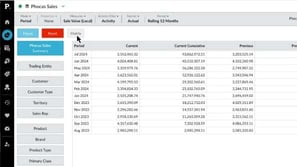
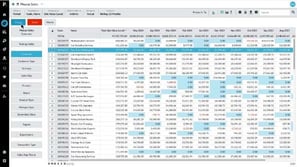
Learn how to enable Matrix mode by selecting a dimension and the rows you want to compare, which then appear side by side as columns in the grid. Add other dimensions to see detail such as regional contribution to sales or sales value by brand. Then select customers and filter a column to equals zero to find those who bought one item but not the other, giving you cross-sell opportunities.
 Analytics (Classic)
Focus on data
Learn how to start from the dimensions on the left and use Focus to isolate specific data as you explore. You'll narrow from a customer to a product type to individual products, see your selections as filters at the top of the screen, and use Reset to clear them and start over.
 Financial Statements
Highlight financial performance using a waterfall chart
Learn how to use the waterfall chart to see how months contribute to changes in a result, like expenses compared to last year. You'll also add a dimension in matrix mode, such as branch, to find which entities drive a variance, and use the lower is better option when a decrease is good.
 Budgets & Forecasts
Explore the forecast workbook
Learn how to read the total columns in a forecast workbook, edit the reforecast periods, and use the spread options snap to budget and follow actuals to revise future values. You'll also learn how to publish the forecast to a stream and compare performance against both budget and forecast in Financial Statements.
 Financial Statements
Reference a single account code in calculations
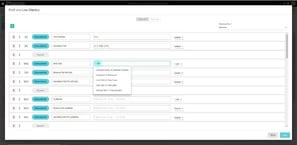
Learn how to use the ACC function to build calculations that reference individual accounts in a Financial Statements statement. For example, you can add gross profit and gross profit percent for online sales only, so you can compare different sales channels and cost of sales channels.
 Financial Statements
Create an indirect Cash Flow statement using 'hide rows'
Learn how to create an indirect Cash Flow Statement in Financial Statements. You start from profit, add back non-cash items like depreciation, interest, and tax, then use those same groups with balance sheet movements to derive working capital and net cash CapEx, while hiding rows to keep the view clean.
 Financial Statements
Combine statistical and financial data for better business insights
Learn how to use statistical streams in Financial Statements calculations with the STAT and AVG functions. STAT adds values over time, while AVG averages them, so you can calculate revenue per unit sold or operating profit per customer and compare performance across business entities.
 Financial Statements
Bring statistical streams into a Financial Statements database
Learn how to add statistical streams to a Financial Statements database in Designer so you can include non-financial information, such as units sold or customers, alongside your financials. You create each stream, mark it as statistical, assign a sync item, map the values, and build the database.
 Budgets & Forecasts
How to handle key variables, such as currency, in the budget
Learn how to cater for multiple currencies in a budget created in one base currency by adding a manual entry driver tab for key variables such as exchange rates. You'll then use working lines to convert local currency values back to that base currency and search for everywhere a currency is referenced.
 Budgets & Forecasts
Workflow history
Learn how to trace who worked on a budget row and what changed in a cell by using the workflow history and cell history. You'll also see how row and cell comments let you explain values, share links, and collaborate, giving budget owners a full audit trail of the budget or forecast.
 Budgets & Forecasts
Delegate a budget line to another user
Learn how to assign budget rows to other users as tasks, one at a time or several at once, so they can enter the values. You'll also see how to review submitted tasks using workflow history and comments, then accept, reject, or mark rows complete so you can track progress at a glance.
 Budgets & Forecasts
Understanding workflow and task assignment
Learn how workflow lets budget owners delegate rows to other users while keeping one version of the truth, since only one person can edit a row at any time. You'll also learn how to read the workflow column, including the predecessor identifier, status button, and reference column, and how to collapse it.
 Financial Statements
Customize your Cash Flow Statement
Learn how to customize your Cash Flow Statement in Financial Statements, the same way you customize a Balance Sheet or Income Statement. You add an accounts receivable group, assign the relevant accounts to it, and adjust the calculation to see how receivables affect cash flow over a period.
 Financial Statements
Add a custom calculation to your Income Statement
Learn how to add an EBITDA calculation to your Income Statement in Financial Statements. You create an Interest, Taxation and Depreciation group, assign accounts to it, and add the calculation. Then you update net profit so it reflects the new layout, and rebuild the database to see the result.
 Analytics (Classic)
Set your default period for a database
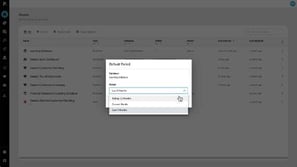
Learn how to replace the default period an administrator set for a database with one that suits you. You'll find the database on your homepage, open its menu, choose Set default period, and save, so the database opens with your chosen time frame from then on.
 CRM
Map accounts
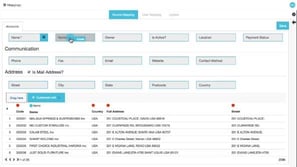
Learn how to bring customer data from external sources into Phocas CRM by mapping source fields to account fields, where only name and number are required. Map owner values to CRM users, then run the update right away or schedule it. By default only blank fields are updated, and you can enable Override existing values to make your original data source, such as your ERP system, the source of truth.
 Analytics (Classic)
Add levels (grid nesting)
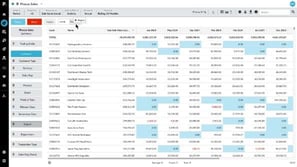
Learn how to use the Nest feature to drag dimensions into the levels box and group them in an expandable grid. Choose a base level, add levels such as region and sales rep, then reorder, add, or remove levels to see detail like which customers a sales rep serves or which products those customers buy. It helps you review how different items contribute to your overall results.
 CRM
Manage activities in My agenda
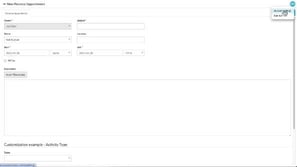
Learn how to open My Agenda in CRM to review the tasks, meetings, business notes, phone logs, and personal appointments scheduled for the next seven days. Filter or search the list, open overdue activities and mark them completed, change the timeframe, and add new activities. You can also choose in your account settings to receive your agenda by email at a set time.
 CRM
Use the CRM analysis dashboard
Learn how to use a dashboard that combines data from your CRM database with your sales database, including activity counts, promotions, revenue, and profit per activity. See how your value per activity compares with the company-wide average, alongside customer account information and sales versus budget gauges. You can also embed your CRM calendar directly in the dashboard.
 CRM
Manage contacts and leads
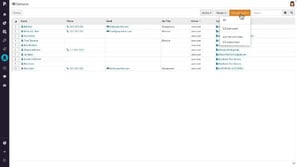
Learn how to manage contacts, the people connected to a customer account, in Phocas CRM. Find them with filters and search, add new ones from the Contacts page or an account, and set a primary contact. You'll also learn how to create leads for new business opportunities and convert a lead into a contact on an account, keeping all of its activity.
 Analytics (Classic)
Compare multiple data streams
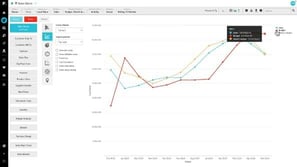
Learn how to use Stream mode to compare multiple data streams on one screen by adding streams in the Variant Stream dropdown, such as budget, stretch budget, and previous sales. Variances appear as values and percentages, and you can show them as a target percentage and sort the columns. Switch to summary and a line chart to see how you're tracking against your targets for the year.
 Analytics (Classic)
Change the period (Analytics Classic)
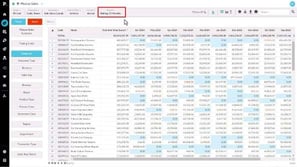
Learn how every figure in the grid is tied to a period, which sets the date range and the basis for comparing current and previous values. Choose a predefined period, check the dates it uses, and, with the right permissions, apply a temporary custom period or save a user defined period with fixed or dynamic dates. You can also change a database's default period from the homepage.
 Administration
Assign and edit user profiles
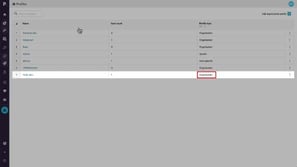
Learn how to update an organization profile, such as renaming it or adding sharing permissions, and apply the changes to every user assigned to it. You can make these edits from the Profiles page or from an individual user's account, and you can also create a user specific profile when none of the existing profiles fit.
 Administration
Add an organization profile
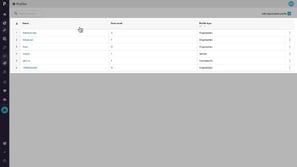
Learn how to compare default profiles such as Administrator, Basic, Advanced, and Viewer, then create an organization profile from scratch for a team like field sales. You choose which permissions to allow or remove, for example full query access without export rights, and then assign the profile to multiple users, which makes permission management much easier.
 Analytics (Classic)
Use Market Mode to analyze market penetration
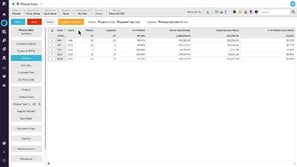
Learn how to define a market, choose a segment, and count items such as customers to calculate market penetration in Market mode. You'll also see how the market, segment, and percent of market columns work with your measures, and how to clean up the view by switching measures off.
 Administration
Manage folders
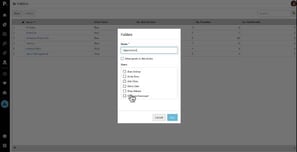
Learn how to create a folder in Administration, name it, choose who has access, and decide whether they can post to it, noting that profile settings still determine posting permission. You can see how many users each folder is shared with and how many favorites and dashboards have been shared through it, and rename it, change access, or delete it. Deleting is permanent.
 Analytics (Classic)
Configure the chart options
Learn how to use the chart configuration settings on the left to change how a chart looks and what it shows. You'll switch between bar, column, and line charts, stack areas, adjust the legend, tooltips, and data labels, select segments directly in the chart, and use auto axis scale to remove empty space.
Administration Update users in bulk
Learn how to select several users in Administration, then choose More and Bulk update to change their profile, grant folder access, and give them database access with a default period. You can restrict what they see by dimension, measure, and data filters, such as limiting them to their own area. A summary lets you review and confirm the changes before they run.
 Administration
Importing users with CSV Import
Learn how to import several users from a CSV file that has eight columns in a set sequence, saved from a spreadsheet. You select the users to load, assign them to a folder, require a password change at first login, and choose their database access and default period. Afterward, you assign profiles and restrictions in bulk or one user at a time.
 Administration
Clone a user
Learn how to clone a user from the Users page by choosing a username, display name, and password, and requiring a password change at first login. The new user keeps the cloned profile and database access, which you can adjust, including adding another database with a default defined period. Fill in the blank address field so they aren't prompted for it at first login.
 Administration
Add users
Learn how to add a user from the Users screen in Administration by entering a username, display name, email language, time zone, group or team, and license. You then assign a profile and give access to a database with a default period. You can also clone an existing user to save time when adding similar users.
 Administration
Add a defined period using Dynamic Month option
Learn how to define a default period in a database's Defined periods tab using the Dynamic Month option, which replaces the year with Most recent or Second most recent. You set a current period from the first month of your financial year to the current month, then a previous period for comparison. The new period appears in the list and updates automatically each year.
 Administration
Set defined periods for a database
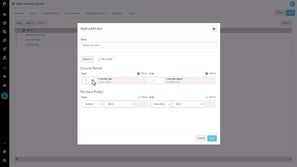
Learn how to manage database periods as an administrator by opening Databases and the Defined periods tab. You can add a predefined period from the common list or create your own, such as a rolling quarter based on offsets from today's date. Once you save at the database level, the period is available to everyone who uses that database.
 Administration
Create a working days calendar
Learn how to set up a working days calendar in administration by naming it, choosing the start and end years, and excluding weekends. You then mark public holidays as non-working days and set a half day to 0.5, and apply the calendar through the Daily average option in Format in Phocas Analytics for more meaningful results.
 Administration
Reset and expire passwords
Learn how to reset passwords from the Users screen in administration, either by emailing users a system-generated password or by setting one manually. You can also expire passwords for selected users, so each person is prompted to set a new password the next time they log in to Phocas.
 Administration
Add a defined period using Special Offsets (days)
Learn how to add a defined period in a database's Defined periods tab using the special offset option, which is only available for days. You set the current and previous period start and end points by choosing Match yesterday with a month offset of zero or minus one, so you can compare yesterday's sales with the same day last month.
 Administration
Manage a user's database access and restrictions
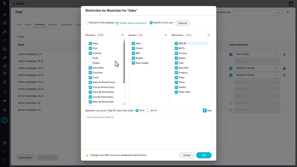
Learn how to manage a user's database access from the Databases tab, including how a specific user restriction overrides the database's default restrictions. You clear the measures, streams, and dimensions a person shouldn't see and add granular dimension restrictions, such as limiting a user to one country, so each person only sees the data they need.
 Platform
Set a dashboard as your home page
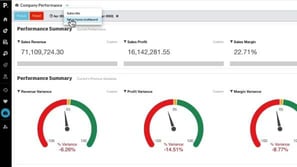
Learn how to save an important dashboard as your home page. Open the dashboard, use the arrow next to its name to choose Set as Home Dashboard, and confirm. The next time you log in to Phocas, that dashboard opens first, so you can get straight to the information you check most.
 Analytics (Classic)
Create an interactive dashboard
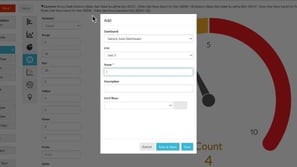
Learn how to set up a dashboard with a name and owner and decide how it's shared, then add content as widgets. You'll add one from a favorite, build another directly in the dashboard as a donut chart of sales by brand, and make it filterable so you can focus on specific data and reset back to the overview.
 Platform
Use dashboards
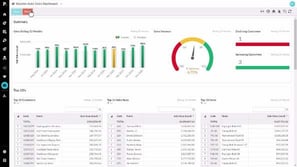
Learn how to explore a dashboard by selecting data in a chart and choosing Focus to filter the view, then using Reset to return to the default. You also see how to open the underlying data in the Phocas Analytics grid with Analyze, set a home dashboard, and subscribe to dashboards to receive email updates at a time and frequency you choose.
 Analytics (Classic)
Forecast months of stock on hand (custom mode)
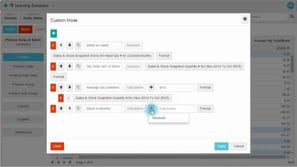
Learn how to add a calculation in Custom mode that divides stock on hand by the average monthly quantity sold over the last 12 months. You'll define both measures and use offsets so the date range updates automatically, which keeps the column accurate if you save it as a favorite.
 Analytics (Classic)
Create a 'low margin' alert
Learn how to use Advanced Search to find products that meet margin and sales criteria, such as margin below 15% and sales above 50,000, then create an alert from the results. You'll set the traffic light thresholds, find the alert on your homepage, and subscribe to get updates at the frequency or trigger you choose.
 Analytics (Classic)
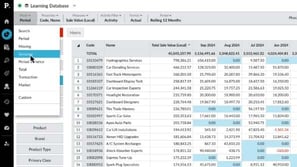
Show positive or negative variance
Learn how to switch to Variance mode to see current sales, previous sales, and the difference in dollars or percentage for each customer or product. You'll change the period, sort by the largest positive or negative variance, and apply the same approach to any dimension.
 Analytics (Classic)
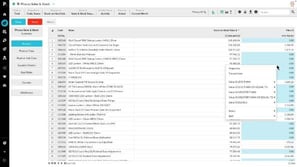
Combine inventory and sales to find dead stock
Learn how to identify dead stock by comparing stock on hand value with sales value by product in total mode. Right-click a cell showing zero and filter for an exact value of zero to list items with no sales in the current month, then slice by warehouse and supplier to see where the most dead stock sits. You get the information you need to act on it quickly.
 Analytics (Classic)
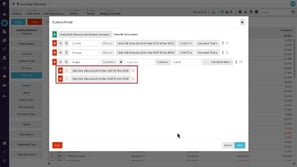
Generate a budget based on previous sales (custom mode)
Learn how to use Custom mode to turn sales from the past two years into next year's budget. You'll add a calculation column that averages the current and previous periods, applies a percentage increase, and then view the resulting budget by product type for a selected sales rep.
 Analytics (Classic)
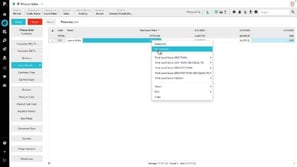
What did I sell yesterday? (using transaction mode)
Learn how to filter the grid to a sales rep, set the period to the current month, and open the transactions behind their total sales value. You'll sort by date to see the most recent sales, add properties or measures for more detail, then export the view to Excel, email it, or save it as a favorite and subscribe the rep to it.
 Analytics (Classic)
Examine accounts receivable over 90 days
Learn how to examine an accounts receivable database to see which customers owe you money past 90 days. You'll select the aging ranges, focus on accounts above a chosen amount, break the balance down by account owner to know who to contact, and save the analysis as a favorite.
 Analytics (Classic)
Track sales rep performance against budget
Learn how to bring a budget stream into your grid with stream mode and compare it to sales by country and sales rep. You'll sort the variance column to surface weaker performers, then shorten the period or switch to Period Mode to check individual months for patterns or anomalies that may need follow-up.
 Analytics (Classic)
Work with the grid (Analytics Classic)
Learn how to open a database and understand what you see, from the summary view to the saved view of a favorite or alert. You'll get to know the grid, the dimensions, and the options along the top, and how to chart or export your results, save a favorite, create an alert, add to a dashboard, or set a default view.
 Analytics (Classic)
Save a favorite
Learn how to save a favorite from a view you've set up, such as the top ten products for the current month. You'll name it, add a description, choose the period it opens in, and share it with folders or specific users, then find it again in the menu or on your homepage.
 Analytics (Classic)
Get more options for viewing data
Learn how to fine-tune your data view with the options menu above the grid. You'll show the remaining sales as an others line, display an average, hide the total, view totals as an average, and reveal products with activity but a net zero value, such as a sale followed by a credit.
 Analytics (Classic)
Change the data format
Learn how to use the format menu to move from actual figures to other formats, which vary by mode and by whether a dimension is selected. In total mode with sales value and profit value selected, switching to percentage share shows each customer's share of both measures. This helps you find customers that make up a larger share of sales than of profit.
 Analytics (Classic)
Gain more screen space and other tips
Learn how to declutter the grid by hiding the status and dimensions, lock a selection so it survives a reset, and freeze properties while you scroll horizontally. You'll also copy cells into other applications and export grids, charts, and dashboard widgets, depending on your permissions.
Hmmm...
We couldn't find any matches "".
Try removing a filter or changing your search term.

