Phocas earns two top rankings and 15 leading positions in BARC's The Analytics & AI Survey 27
Business intelligence (BI) is valuable in distribution when people use the tool and it improves how they operate. Customer feedback in BARC's Analytics & AI Survey 27 proves Phocas Analytics, the flagship BI product on the Phocas platform supports this usability and benefit requirement, with top rankings for Product Satisfaction and Performance & Scalability.The results cover two peer groups that Phocas Analytics is categorized in which are the Report and Dashboard Focus and Midsize/Departmental Implementations. Together, they highlight customers’ experience of using Phocas Analytics and working with the Phocas implementation and customer success teams.
The benefits extend into business operations where 100% of Phocas customers who participated in the survey achieved some improvement in the speed and accuracy of reporting, analysis or planning, while 91% reported improved operational efficiency.
What do the BARC Analytics & AI Survey 27 results mean?
BARC provides independent global research based on feedback from people who use BI and Sales Analytics software in their businesses.
The Analytics & AI Survey 27 gathered responses from 777 users and analyzed 17 different analytics products against 30 criteria, including Business Benefits, Customer Satisfaction and Price to Value. The results help software buyers understand how products perform in practice. A top-ranked result means first place within a peer group, while leader generally indicates a position among the top 22–33% of products compared.
Phocas Analytics achieved top rankings for Product Satisfaction and Performance and Scalability in the Report and Dashboard Focus peer group and 11 leading positions including Implementation Success, Price to Value, Vendor Support, Implementer Support, Recommendation, Sales Experience, Customer Satisfaction, Analytics, Embedded Analytics, self-service and user experience. In the Midsize/Departmental Implementations section, Phocas Analytics achieved four leader positions for Product Satisfaction, Sales Experience, Embedded Analytics and Performance and Scalability.
Dashboards and reports that people use
Dashboards are a central part of how customers work with Phocas Analytics. Of those surveyed, 96% use Phocas dashboards, 79% use the platform for analysis and 75% for reporting. These uses overlap, showing how customers bring different ways of working with data into the same platform.
For a distributor, a dashboard might highlight a change in branch sales or a decline in gross margin. Analysis helps someone investigate which customers, products or transactions contributed to that change, while reporting helps them share the findings with colleagues.
In the Report and Dashboard Focus peer group, Phocas Analytics was top-ranked for Product Satisfaction, with a score of 8.9, and Performance and Scalability, scoring 8.65. One respondent summed up their experience as “it simply works exceptionally well”.
The feedback on specific functionality is positive too with 88% of respondents rating Phocas’ dashboard/report viewing functionality as 'very good' or 'good'.
That combination is important for distributors that want an easy-to-use platform as well as strong performance enabling them to analyze much of their transactional ERP data and other data sources.
Self service backed by responsive support
Phocas Analytics achieved a leader position for Self-Service in the Report and Dashboard Focus peer group. One respondent described Phocas as “the king of ad-hoc analysis systems.”
Self-service is particularly relevant in distribution, where questions often need answers from the people closest to the customer or stock. A sales manager investigating a change in buying behaviour or a purchasing manager reviewing slow-moving products need quick insights.
The self-service result sits alongside a leading position for Vendor Support in the same peer group. Customers want to investigate independently, with access to knowledgeable help when they need it.
One respondent described Phocas support as “very good, trustworthy and wants to collaborate with you. Always willing to go the extra mile.”
That feedback recognizes the industry knowledge behind the software. Helping customers use their data involves understanding what they want to achieve and working with them as their needs develop.
Leading results for midsize and departmental implementations
In the Midsize/Departmental Implementations peer group, Phocas Analytics achieved leading positions for Product Satisfaction, Sales Experience, Embedded Analytics and Performance and Scalability.
These results cover several parts of the customer experience, from evaluating the platform and working with the sales team to using its analytical capabilities. The recognition for product satisfaction and performance across both peer groups adds consistency to the feedback.
For midsize businesses, that combination is relevant to how they choose and use technology. Teams need to understand whether a platform fits their requirements, then use the Analytics and BI platform across the business.
Improvements beyond reporting
BARC’s findings show that Phocas customers see benefits beyond reporting. The BARC analyst noted, “Every Phocas respondent who answered the relevant question reported some improvement in the speed or accuracy of reporting, analysis or planning. 91% also reported improved operational efficiency, and Phocas had the third-highest share of respondents reporting increased revenue.”
These are customer-reported results, not a promise that every business will see the same outcomes. They show how distributors are using Phocas Analytics to support the running of a distribution business across many different industries such as building products or automotive afterparts.
For the distributors we work with, Phocas Analytics should help people understand what is happening and decide where to focus. These BARC results show customers using Phocas dashboards, reports and analysis to do that with confidence.
Phocas in the BARC Analytics & AI Survey 27
Download now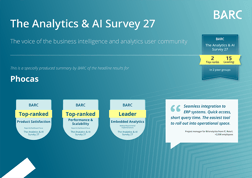


Katrina is a professional writer with a decade of experience in business and tech. She explains how data and AI can work for distribution professionals and finance teams without all the tech jargon.
Related blog posts

As businesses continue to rely on analytics tools, such as business intelligence solutions, to improve decision-making and manage performance, the value of cloud-based business intelligence has become essential. Cloud BI combines powerful data integration and business analytics with the accessibility and flexibility of cloud technology, enabling companies to gain insights from anywhere.
Read more
For any Sales Director, the ability to measure and communicate your team’s sales performance quickly but accurately is essential.
Read more
Conversational AI security is how you control what an AI assistant can see, how your business data is used and whether you can check its answers. For distributors, that means keeping existing user permissions, ruling out model training on your data, guarding against prompt-based leaks and verifying every output.
Read moreBrowse by category
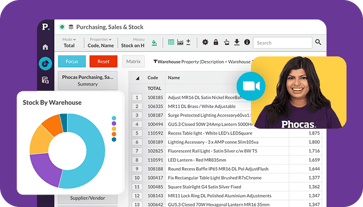
Find out how our platform gives you the visibility you need to get more done.
Get your demo today