Learn how to explore your rebate data in the Analytics module to track performance, monitor rebate activity, and uncover insights that help you make informed decisions.
Learning modules
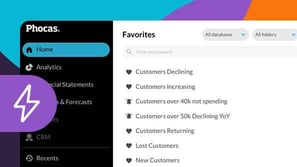
Phocas Analytics QuickStart

Financial Statements QuickStart
This module for beginners helps you get started in Phocas Financial Statements. Learn about the grid, layouts and charts and how to add a favorite view to your dashboard.
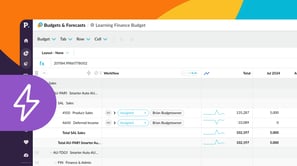
Budgets & Forecasts QuickStart
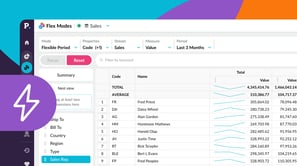
Flex Modes QuickStart
This beginner-friendly module walks you through getting started in Flex Modes and shows you how to run simple analyses for quick insights. Learn how to explore your data with Flex Modes and see how the different modes and features give you the flexibility to view, compare, and analyze your information in ways that work best for you.
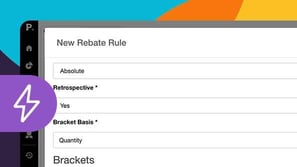
Rebates QuickStart

Analyze your financial statements
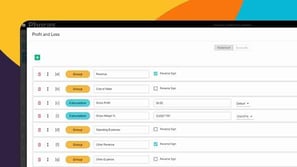
Customize your financial statements
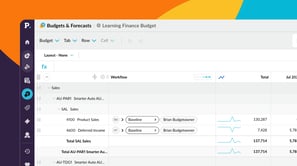
Manage budgets and forecasts
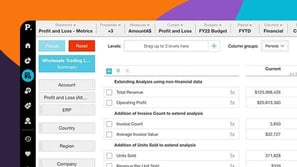
Grid customization basics
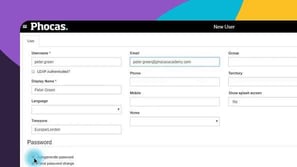
Set up users
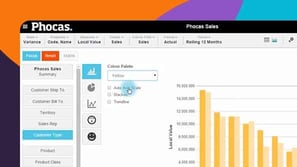
Turn data into a chart
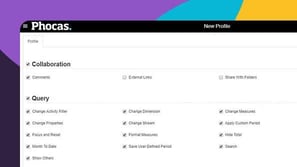
Profiles, permissions and restrictions
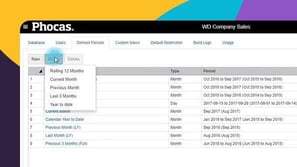
Defined periods
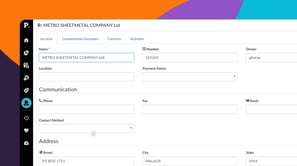
Phocas CRM
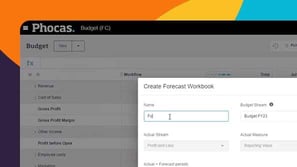
A simple way to re-forecast
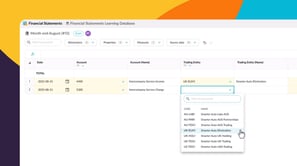
Add data to your financial statements


 Help & support