CRM pipeline analytics for distributors and stage conversion reporting
In the Phocas State of Sales in Distribution 2026 report, 34% of distributors said they don’t measure their new-business win rate and 39% don’t track forecast accuracy or don’t know what it is.
That’s a lot of pipeline running without much visibility across a distribution sales team. Using a distributor-focused CRM for pipeline analytics help sales leaders report on every stage of the deal and plan next steps for each stage conversion.
Why stage conversion reporting is tricky
Most CRMs are good at holding deals and weak at explaining them. To determine the win rate by stage, many sales teams need to export deal information into a separate BI tool, which means a lot more work.
The Distribution Sales research shows how difficult this reporting is to achieve. Pipeline and forecast accuracy is the second most-cited internal issue for distributor sales teams, at 18% and 16% say disconnected systems leave them relying on manual workarounds.
How the visual pipeline captures the data BI needs
Distributors know all too well that the way a sales pipeline is maintained is indicative of how effective the reporting is for a sales team. In the State of Sales in Distribution Report, among distributors with a CRM , just 34% log 75% or more of their customer interactions in it. When asked what capability would help improve sales, better CRM adoption was the most stated response.
Distributors need a CRM that makes updating the pipeline easy. In the Phocas CRm, each stage is represented as a column on the pipeline board. Each deal, bid, quote or project is a card, and reps drag it to the next stage as action moves.
Every card carries the fields to match reporting needs such as value, expected close date, owner, linked account and campaign. Your administrator can also set up separate pipelines for quotes, projects or tenders, with stages that match how you sell. You can filter by owner, team or campaign to focus the board.
CRM data is best when it can be analyzed in the same system as the pipeline information. The sales database is designed to match your process with fields for stages and regions and a sync from the ERP on a daily or hourly basis.
What stage conversion reports look like in practice
Distributors often asking us for reports that are suited to their specific vertical. Here are a few example of what has been requested and how they have created the report.
'Give me a rolling 180-day win rate by project, not by dollars. Can we count projects won against projects closed instead?'
A day-based offset period in Phocas Analytics rolls forward on its own, and you can compare it with the previous 180 days (or a time frame that best suits) to see which way the business is heading.
'Cascade that win rate by stage. Close rates climb as projects advance.'
One distributor quoted roughly 70–80% once a project reaches subcontract awarded, against a 60% benchmark. Break win rate out by stage and you can see where deals firm up and where they fall apart.
'Show me pipeline by month and by region. One team described the need as going from simple to complex quickly.'
Start with pipeline by month then use Matrix mode in Analytics to lay region alongside it and drill into the deals behind any number.
'Compare my forecast with my quotes.'
This sales team built a sales forecast stream from forecasted close dates and set it against their quote stream to check they’re on target. Stream mode in Analytics to put two streams side by side with the variance, and every pipeline card already holds an expected close date.
“I want a funnel picture.'
Put quotes, pipeline and conversion ratios on one dashboard. A bar chart of projects by stage reads like a funnel, with your conversion ratios and quote stream beside it.
Divya Manohar, a Phocas sales data expert says "Watch the trend, not the snapshot." A single win rate tells you where you are but the pipeline stage trends tell you where you’re heading.
Start with one stage and build from there
You don’t need a perfect pipeline to see where deals are dropping off. You need one number you trust and a habit of checking it.
Pick the stage where you suspect deals stall most often. Track how many projects reach it and how many move on, month by month. Do that for a full quarter before you add anything else. A simple trend you update every month tells you a lot.
Three questions will guide you:
- Where do deals firm up? Find the stage where close rates climb, then protect it.
- Where do they fall apart? That’s the stage to coach first.
- Is the trend moving the right way? Compare against the previous period, not just last month.
Remember the numbers from the start of this post. Over a third of distributors don’t measure their new-business win rate at all. If you track even one stage conversion consistently, you’ll know more about your pipeline than they do – and you’ll spot the problem while there’s still time to fix it.
Frequently asked questions
The State of Sales in Distribution 2026
Download now

Related blog posts
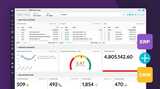
If you work as a sales leader in distribution, a deal is usually counted by finance when the invoice goes out or the payment is received. Yet, if you use a generic CRM system, the sales win is often recorded as soon as the rep gets off the call with the new order. The CRM shows the original deal value. The ERP holds the details of what actually happened. For a distribution sales leader, that gap makes it harder to judge performance. You can see what the team has won, but you still need another report to find out what was invoiced, what remains outstanding and how much margin the sale generated.
Read more
Everyone working in distribution needs access to CRM for different purposes. A rep might manage customers across several branches and the regional manager is overseeing multiple states and reps. Finance partners often need visibility into major opportunities or want to check the terms of a sale but wouldn't edit transactions.
Read more
One in five distributors say their most pressing sales problem is reps not knowing which accounts to prioritize, according to Phocas' State of Sales in Distribution report. Guided selling takes over the digging, telling each rep who to call, why and what to say. Working out where to focus means checking who's stopped ordering, which product lines have slipped and where there's room to sell more. Reps can do that by hand, but it takes hours across different reports. Guided selling in a CRM built for distributors brings those answers to them, ranked by revenue impact, with every next step tracked.
Read moreBrowse by category
Find out how our platform gives you the visibility you need to get more done.
Get your demo today