Phocas Financial Statements: Visualize your financial analysis
5:40 minutes total learning time
With a visualization tool that slides out alongside the statement, you can continue to interact with the grid and the chart will dynamically respond to any changes you make. Learn how to make the most of this feature.
Phocas product
2 videos in this learning module
1
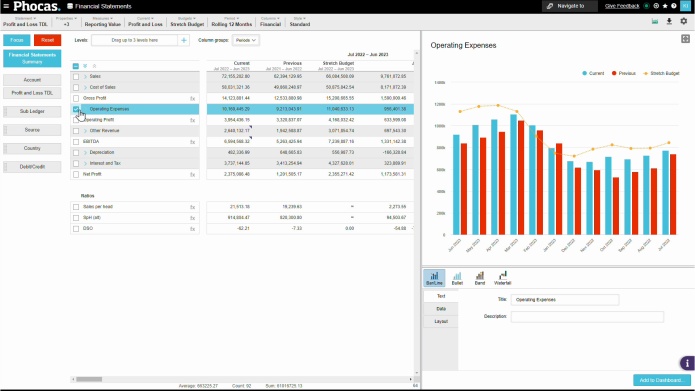
Display financial information in a chart
2:05
2
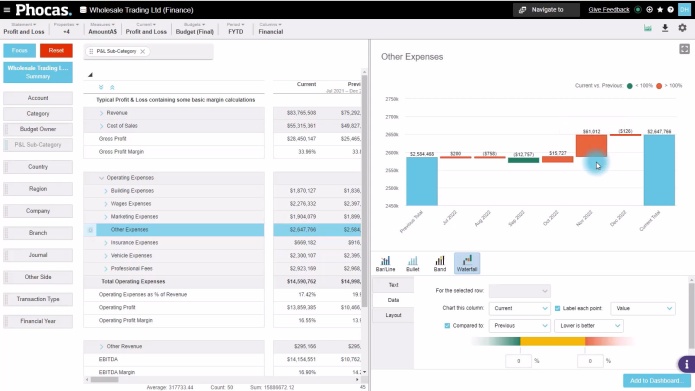
Highlight financial performance using a waterfall chart
3:35
2 videos in this learning module
1
Display financial information in a chart
2:05
2
Highlight financial performance using a waterfall chart
3:35
Display financial information in a chart
Visually explore and interact with your financial information to see trends at a glance.
Supporting documentation
Highlight financial performance using a waterfall chart
This video shows how to use a waterfall chart to highlight financial performance over time, and use the chart in matrix mode to see how entities have contributed to that performance.
Supporting documentation
Phocas product

Related learning modules
Financial Statements QuickStart
This module for beginners helps you get started in Phocas Financial Statements. Learn about the grid, layouts and charts and how to add a favorite view to your dashboard.
Financial Statements: More on customization
Learn how to make the most of the flexibility available to you when customizing Financial Statements.
Phocas Financial Statements
Phocas Financial Statements brings financial reporting and business intelligence together, allowing Finance teams to customize financial statements, compare, consolidate, drill down and analyze.