What is data analytics?

Find out how our platform gives you the visibility you need to get more done.
Get your demo todayWhat is data analytics?
Companies create a mind-blowing amount of data each minute, day, year… this information is only valuable if you can translate it into useful insights.
Data analytics is the process of collecting, processing, and analyzing all this raw data to discover valuable insights, patterns, and trends.
Data analytics is widely used across industries to gain a deeper understanding of operations, customer behavior, and finance, enabling organizations to make data-driven decisions and optimize planning, products and pricicing for improved performance and outcomes.
What is data analytics software?
Data analytics software (often called BI or business analytics software) uses statistical techniques to cluster, segment, and interpret business data from multiple sources and present them in a simple format so people can make better decisions.
The information generated from different systems and operations centers can be used for a variety of business benefits. While the data is likely aggregated in a central ERP system, it is not in a format that everyone can access and use. Data analytics software converts the raw information into easy-to-understand charts, graphs and tables. It helps score and compare what happened against forecasts and budgets and better prepare for what will happen next.
Adapting to this mindset of “data for all” is crucial to those in IT, accounting and sales management, who have traditionally used and controlled the data. Gone should be the gatekeepers and bottlenecks and the future of data analytics lies in its ubiquity.
Data analytics fundamentals. Why data relationships are important.
Data sources and unifying data. What you need to know?
In order for your team to have confidence in data, they need to know that the information they are using for decision-making represents a clear and accurate picture of business performance. Is your data analytics a single source of truth or do you have conflicting and disparate data sources?
As you look to connect data sources, unify and leverage your data, consider these terms and phrases which can often carry different meaning for different people.
An application programming interface (API) – code that allows two software programs to communicate with each other. APIs are critical to ensure that systems integrate and data flows seamlessly.
Database - a structured set of data held in a computer, especially one that is accessible in various ways. Data analytics will pull data from a variety of databases and present the data in graphical summary.
Data warehouse - a large store of data accumulated from a wide range of sources within a company and used to guide management decisions. A unified data warehouse consolidates information from all relevant sources so analysis and reporting is more effective and complete.
Query - a question, often required to be expressed in a formal way. As you integrate systems and data, you will use analytics to query a database to pull information so that you can find answers to your business questions. The results of queries may be presented through dashboard visualization or reports.
Slice and Dice - the ability to divide a quantity of information into smaller parts, especially to analyze it more closely or in different ways. As different data sources and silos are integrated, the ability to slice and dice becomes a critical practice to uncovering opportunities and challenges.
Actionable insights: the benefit of real-time data analysis on decision making
Data analytics software use cases.
Data analytics helps companies become more data driven, making it easy to drill down from high-level visual summaries into the underlying data and arrive at insights to make better decisions. Data analytics aggregates and queries data, and then reports in real-time.
Below are several ways to use data analytics software to benefit your company:
- Track key performance indicators to understand and improve execution
- Predict trends and identify future opportunities and challenges
- Create a single source of truth that aggregates data from across the enterprise, improving data accuracy and collaboration
- Use real-time, accurate data to accelerate and improve business decision-making
- Optimize business processes to increase productivity and efficiency
- Use data to track customer purchasing habits to improve loyalty and optimize marketing and sales programs
- Provide executives with the information they need to improve strategic planning and lead the company
- Obtain higher margins
- Reduce costs and waste
- Extend the life of your ERP
- Build the team's analytic skills for more data-driven decision-making
Which industries use data analytics tools?
Given the volume and variety of data generated in manufacturing, distribution (healthcare, plumbing and HVAC, lighting, automotive parts) and retail, for example, it’s critical to have an automated way to convert and analyze the raw information into actionable insights. Data analytics solutions help team members of all skill levels the opportunity to base their decision-making on facts.
Equipment Controls Company (ECCO) provides natural gas measurement products to a variety of utility and non-utility customers. Tod Bradley joined as Chief Operation Officer four years ago, he developed a high-level plan that included using Phocas data analytics to organize the company’s data and double the company’s business in five years. They did it in four.
“Hardly anyone speaks now without looking at Phocas first,” added Bradley.
Gustave A Larson, a leading distributor of commercial and residential HVAC parts and refrigeration equipment, appreciates that everyone across the company is using actionable information to make timely and accurate decisions.
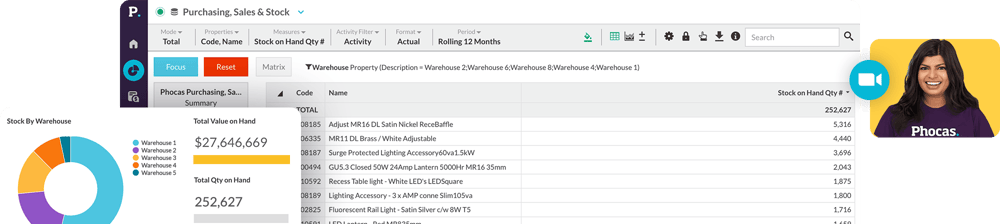
Wessex Packaging has greater visibility into sales, purchasing and inventory data, which is helping to shape pricing and warehouse decisions.
British manufacturer CQR Security deployed data analytics to track sales and get a better understanding of top-performing products.
Whiting Holdings, an Australian steel distributor, consolidated all its financial, sales and inventory data into one platform, to make it easier to report and dashboard KPIs across the entire organization.
For Bunzl Safety, makers of personal protective equipment, having clear, 360 degree visibility into business performance has never been more important.
How do you choose a data analysis tool?
Selecting the right data analytics solution has never been more important. Data is a critical business asset, and better data leads to better decisions. When considering a data analytics solution, start by discussing your pain points and unique requirements with leaders and end-users. Once you have an understanding of what’s guiding this decision, review your organization's resources, including people and systems that will support and manage the software today, and then consider your size and what will be needed in the future.
As you review your infrastructure, security, network and systems, there are several important factors to consider such as where your data is stored, and what types of data you have and want to analyze. These will form part of your evaluation process going forward as you look for a flexible solution that makes it easy to integrate systems and data. You will also want to understand any skills gaps that you have and will need to fill, and whether your team will use the software and help your business.
The right data analytics solution will make it easier for your team to use your information to draw actionable insights and maximize opportunities for your organization.
Selection criteria: evaluating data analytics software providers.
Before starting the process of searching for a data analytics solutions, make sure you have developed criteria to evaluate the software providers. Don’t be swayed by brands with large advertising budgets or that regularly boast about their new rounds of funding. Consider the following:
- Maintenance, changes and administration of the tool – Does the solution require a team of experts to manage, or was it designed for self-service and the updates come thorugh automatically?
- Degree of difficulty configure reports/dashboards– If the solution is too complex and requires too many training sessions and new skills to use, there is a good chance your team won’t fully embrace the solution. Training is important, but the solution should be intuitive and user-friendly, with self-managed training and additional support from the provider for questions and guidance. Also, consider how fees for the solution are structured. Can you quickly and easily add users as needed? Can you share reports and dashboards with others?
- Scalability - like the investment required to fully use the system, can you cost effectively to scale the solution as your busines grows and even scale down if things slow?
- Data modelling capabilities - Will the solution allow you to integrate a variety of systems and data sets to get the answers you need from your information?
- Data visualization capabilities - Will your people use the visualization features, and can you create the charts, graphs and tables that will make it easy to find value in your data?
- Data security, governance, and access control – Not every user will need access to all the data. Consider how your information is protected and how users’ access rights are managed to ensure they have all the information they need to effectively fulfill their roles and responsibilities.
What type of training and implementation is required to use data analytics software?
The amount of training and intensity of the implementation of data analytics software is often dependent on how complicated the software is to use. In some cases, software training doesn’t go beyond a single internal expert who serves as the point of contact for the entire business. In other situations, everyone in the business who plans on using the software can access training. If navigating the software, building dashboards and reports and finding value in the software is difficult, good chance implementation and training will take longer than planned.
Why is training important?
The right analytics solution should be easy to use, making data analysis accessible to more users and increasing engagement in company data initiatives. Certainly, training is important. Even the simplest tools require some training, but expensive and intense ongoing or regular training may be a deterrent to fully embracing data analytics.
The importance of a good implementation process.
For those considering deploying a data analytics solution, it’s critical to have a clear understanding of the value that the software will provide. The next step is to evaluate the software based on the level of investment required, not only financial, but also in terms of the scope of the implementation and how much it could impact day-to-day operations, especially if something doesn’t integrate seamlessly.
Choosing a data analytics solution that is easier to use out of the box can reduce wasted time and energy required on implementation, as well as the resources required to maintain and fix reporting in the future. Businesses want to allocate resources to their team members that contribute to generating sales and revenue, not to reporting.
How does a data analytics tool compliment an ERP?
An ERP system is full of operational and transactional data. It provides an exact view of your business from an operational perspective, but it is not built to perform trend analyses or give you high-level overviews.
Data analytic solutions pull data from the ERP, both strategic (revenue, profit and growth), and operational (daily sales performance), enabling you to conduct in-depth analyses that can deliver high-level insights. With a trusted source of data, you can develop a strategy around data-driven decision making. You can quickly convert raw ERP data into more digestible and actionable intelligence, allowing you to react faster, address many interdependent issues simultaneously, and make decisions across all parts of the business.
Discuss how the data analytics software takes the data out of the ERP and surfaces it in a more digestible format and makes it easier to glean insights from business data.
How can data analytics improve decision-making?
Companies need to understand and have confidence in their data to make strategic decisions. In most cases, information does not come nicely packaged, ready to use, so data analytics is critical to placing intuitive insights at your fingertips.
Data analytics allows you to track and measure performance metrics in a meaningful way. Simply collecting data won’t suffice, you need a solution that can convert the raw information into visual charts, graphs and tables that can help decision makers quickly see a more complete picture of your business. Dashboards make it easy to monitor key performance indicators, allowing you to take action in a timely manner.
With a few clicks, you can dive deeper into the dashboard data, gathering granular insights about a transaction, customer or product that could have major impacts on future sales, customer relations and or purchasing and inventory decisions.
All this data allows you to go beyond gut instincts, using facts to take your data-based decision-making to another level.
One last note. Financial numbers have traditionally been the domain of accounting team. Data analytics software makes it easy to integrate financial information with other performance data, sharing profit, loss and variance with other departments, and allowing more people to engage and invest in the development of a team's performance. Having access to all these data points means decisions will be more holistic and accurate.
Data analytics tools versus spreadsheets.
Because of their familiarity spreadsheets have become catchalls for business data. Unfortunately, spreadsheets are prone to errors and as they become more complex, error rates also increase. An error in one cell can cascade throughout your data, and unless captured in the first version or master copy, the error can go undetected, allowing a company to make decision-after-decision based on flawed information.
Below are several other pitfalls caused by using spreadsheets for data analysis:
- Slow decision making, static analysis - Once a spreadsheet is created, shared and printed, it immediately becomes outdated. The information is static and updating information or changing formulas and macros takes time and impedes timely decision making.
- Siloed data negatively impacts collaboration and creates friction over different data sources - Pulling data from a variety of sources into spreadsheets is difficult, and unless everyone is working off the same spreadsheet with the most recent information, it can be difficult to come to a consensus. Beyond analyzing a few metrics, there is little room for meaningful data discovery.
- Burden of reporting on finite resources or subject matter experts - The majority of spreadsheet users can perform simple functions such as “sum” and “sort.” But most users find it difficult to create complex formulas. An analysis of complex data in Excel often requires much more expertise.
- Unsecure and not scalable - Spreadsheets are often downloaded onto individual computers and then shared through email, which can be easily hacked. Excel does not allow for a built-in editing trail, allowing anyone to edit spreadsheet’s formulas or other data. Spreadsheets can also be freely copied onto unencrypted USB drives and personal cloud-based storage solutions.
Why choose Phocas?
Phocas is a global leader in self-service cloud-based data analytics with solutions that provide simple, yet powerful insights. Phocas was built for users of all skill level, empowering them with relevant sales, forecasting, inventory, pricing, profit margins and other data to make decisions that will improve their individual and company performance.
Phocas improves accessibility to information and analytics to anyone at any time. By making the software intuitive, data analysis and reporting becomes a function and responsibility for more people across your business rather than of a few select experts or the IT department. Phocas data analytics gives anyone, from the sales rep to the CEO, the ability to ask and answer questions of their data. Through easy-to-read dashboards, disparate data is collected into a single source of truth, enabling your team to see on a single screen everything they need to make better decisions.
"Our company has eight business units and uses four different ERPs due to acquisitions. Before Phocas, it was difficult to get sales and financial information. With Phocas, we can make timely and accurate decisions across the business."
Rob Cambra - Director of IT Amesbury Group Inc (BSI Door Hardware)
Phocas’ data analytics features
Key Features
For the past several years, Phocas has finished among the top ranked companies in the largest annual survey of BI software users. Phocas was built from the ground up to make data analytics accessible to everyone across the enterprise, regardless of skill level. Phocas software is tailored for business users and designed to be quickly deployed, and easy to learn and use. Within a short space of time, users are building visualizations and dashboards, slicing and dicing data, filtering and even administering the solution.
Among the other key features and differentiators include:
Phocas speeds up accurate decision-making - Phocas aggregates data from systems and silos from across the business, building a more accurate and complete picture of performance. Phocas enables users to address many interdependent issues simultaneously, act with confidence, assess situations quickly and capitalize on competitive advantages.
Phocas enables easy digital transformation and flexibility - The world is full of uncertainties and questions about the future. Investing in data and a data analytics solution could be the single most important decision that companies make. There is no digital transformation without data analytics. And Phocas empowers teams to run a transformed business that is more digital, efficient and flexible and can respond quickly to new opportunities and challenges.
What value does Phocas data analytics add?
Phocas helps companies use data analytics to make more intelligent decisions and become more data-driven. With Phocas, you can proactively influence the course of your business, whether it’s something that needs to happen today, next week or next year.
Phocas is committed to changing the perception about complexity and intuitiveness that often accompanies the deployment of data analytics software. With Phocas’ low barrier to entry, you can quickly create meaningful and actionable dashboards, scorecards, alerts and reports for every role in your company, so users have convenient access to relevant data to speed up accurate decision-making that will help them do their jobs and grow your bottom line.
Phocas also removes the responsibility of data analytics and reporting from specialists or your IT team, allowing them to focus on more important infrastructure and software system challenges. At the same time, Phocas allows users of all skill levels to dive into the details, find opportunities and create reports that drive strategic decision-making. With a few clicks, users can set up custom dashboards and automated reporting so they can focus on continuous improvement.
Phocas delivers every advantage your business needs to enable digital transformation and capitalize on your data assets so you can operate more efficiently, optimize your workforce, measure business performance, increase productivity, improve decision making and planning, and grow revenues.
Case Studies - data analytics
Muk Haircare
Muk is an Australian haircare brand that manufactures products for hairdressers and salons.
Rob Seeley, Business and Brand Development at Muk, reviews sales and inventory dashboards daily in Phocas drilling into sales by state, by the customer, by product and by channel.
“If we didn’t have Phocas, it would take us much longer to know what’s going on. We’d be in the dark whereas we can change direction quickly and address the needs of customers. Phocas helps us deal with the issues that arise, and we methodically work through each one and move to the next. Phocas is like Siri – ask Phocas a question, and it tells you the answer."
Midway dental
Midway Dental supplies independently owned dental practices with quality equipment and dental consumables. Before deploying Epicor Data Analytics (EDA), powered by Phocas, the company’s small IT team had to program queries in SQL to extract the information they needed from Epicor P21, their ERP.
“We have three people in the IT department who were working full time to get us this information, and now with EDA, we are able to bypass all of this,” added founder Dawn Metcalf.
“The IT department spends its time more effectively on other projects, such as building our new website and eCommerce capability. The sales team and executives can get all the information they need from EDA on their own. The fact that EDA is so simple to use has really helped us.”
Analytics in action: Take a video tour
-

Quick and easy access to data
Learn how you can get quick and easy access to the information you need to make data-driven decisions with trusted data that’s pulled fresh from your ERP. -

Self-serve reports and alerts
Break-free of the cycle of back-and-forth report requests and revisions with IT. Take a look at how easy it is to set up reports and alerts in Phocas. -

Drill down and follow your train of thought
Learn how Phocas lets you drill into your data to get super-fast answers and understand what is happening and why. -

Identify opportunities to grow sales
See how Phocas can grow sales by helping your reps quickly identify easy wins, such as cross-sell opportunities in a few clicks. -

Track profitability of sales
With Phocas you can easily track the actual margins you’re making and identify customers who may be less profitable than they first appear. -

Optimize stock
Forget managing stock using your ERP or spreadsheets – see how Phocas makes it super easy to stay on top of your inventory. -

Phocas AI
Discover how Phocas AI helps you uncover insights quickly helping you drive impact across your business.
Understand the past, operate better today, and plan well for the future