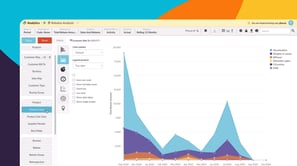
Learn how to explore your rebate data in the Analytics module to track performance, monitor rebate activity, and uncover insights that help you make informed decisions.
Learning modules
 Analytics
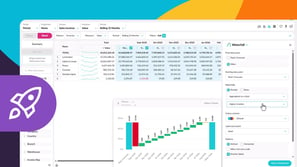
Get started with Analytics
This beginner-friendly module walks you through getting started in Analytics and shows you how to run simple analyses for quick insights. Learn how to explore your data and see how the different modes and features give you the flexibility to view, compare, and analyze your information in ways that work best for you.
6 videos
16:12 min
 Financial Statements
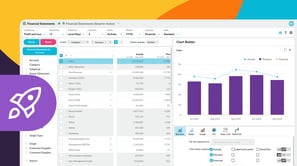
Get started with Financial Statements
This module for beginners helps you get started in Phocas Financial Statements. Learn about the grid, layouts and charts and how to add a favorite view to your dashboard.
6 videos
13:11 min
 Budgets & Forecasts
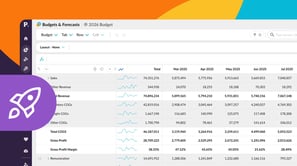
Get started with Budgets & Forecasts
This module for beginners helps you get started in Phocas Budgets & Forecasts. Learn about the grid, filtering, how you can enter data and submit it for approval, and more.
4 videos
9:18 min
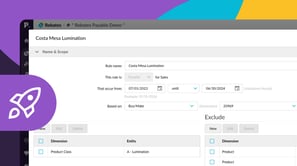
 Rebates
Get started with Rebates
This module for beginners helps you get started in Rebate. Learn how to use Rebates, from setting up and configuring your first Rebates project though to calculating and posting rebates.
4 videos
6:39 min
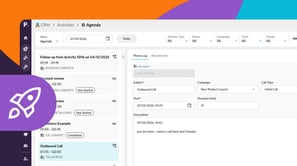
 CRM
Get started with CRM
This module covers accessing your agenda, activities, and the CRM dashboard in Phocas CRM, as well as adding activities and using AI voice to quickly capture meeting notes and follow up tasks, helping you and your team stay on top of customer management.
4 videos
11:14 min
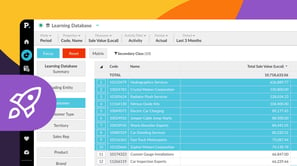
 Analytics (Classic)
Get started with Analytics (Classic)
This module for beginners takes you through getting started in Phocas Analytics (Classic) and doing some simple analysis to get fast results from your data. These videos introduce you to features that you will be using every day.
7 videos
15:19 min
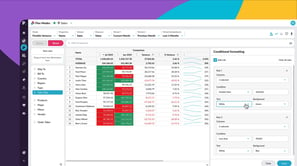 Analytics
Use Analytics
This module takes you through working with Phocas Analytics. Learn how to create filters, structure your data, compare results, and apply formatting to highlight key insights.
9 videos
24:21 min
 Financial Statements
Explore and analyze financial information
Discover how you can change statement views, apply filters, add detail, and drill down into your data to move smoothly from a high-level overview to detailed insights for deeper analysis.
4 videos
8:15 min
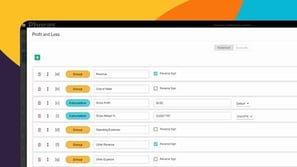 Financial Statements
Create and manage financial statements
Learn how you can customize financial statement layouts and contents to fit your organization's needs by adding, removing, and reordering items.
10 videos
37:48 min
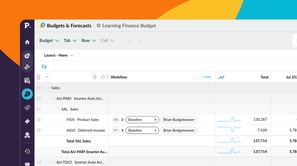 Budgets & Forecasts
Manage budgets and forecasts
This module shows you how to create, customize, and maintain your organization’s budget and forecast workbooks, so you can keep financial planning clear, accurate, and efficient.
6 videos
21:05 min
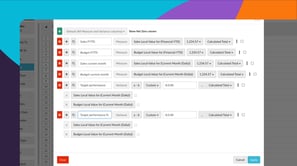 Analytics (Classic)
Explore and analyze data
Learn how you can explore and analyze your data in Phocas Analytics. Discover how to compare data, refine your view, and use advanced tools to uncover insights and understand performance.
11 videos
27:48 min
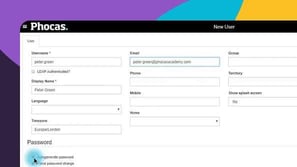
 Administration
Manage users and access
This module covers the fundamentals of setting up new users in Phocas, including adding users, setting passwords, importing new users via CSV, and updating multiple users simultaneously using the bulk update feature.
9 videos
25:29 min
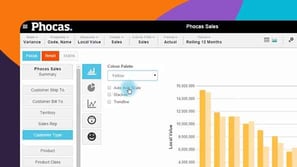 Analytics (Classic)
View data in charts and dashboards
Switching from grid to chart view opens up options for various graphical presentation of your data. This module covers basic chart setup through to advanced configuration, with a detailed look at some chart types.
6 videos
14:06 min
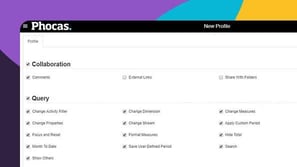 Administration
Manage content and folders
A user's profile defines their access and capabilities in Phocas. This module demonstrates how to assign profiles and permissions to individuals or groups, and how to efficiently manage data sharing across your Phocas site.
2 videos
5:14 min
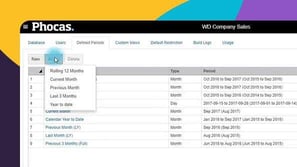 Administration
Set date ranges for databases
Administrators decide what defined periods (date ranges) appear in the Period dropdown menu for each database. Learn how to maintain these.
4 videos
12:14 min
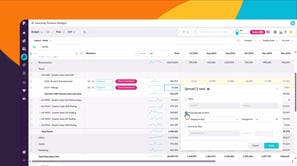 Budgets & Forecasts
Work with budget data
Learn to work with budget data and discover how to edit values, use formulas, and structure your data to build and manage budgets effectively.
5 videos
16:16 min
 Financial Statements
Add data to your financial statements
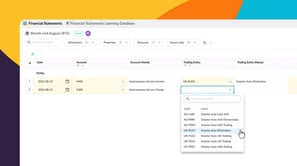
COMING SOON – This module introduces the Journals feature in Financial Statements: a simple, flexible tool for entering debit and credit-style journal entries for tasks like intercompany eliminations and management reporting adjustments. You’ll learn how to make quick manual adjustments between entities, publish them back to your financial statements, and streamline workflows when managing multiple ERPs or using Excel.
3 videos
8:38 min
3 videos
19:42 min
 Sales Insights
Manage Insights
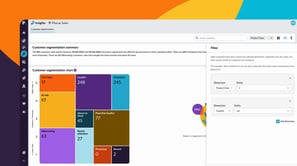
Learn how administrators can set up and manage Customer segmentation in Phocas Sales Insights. This module covers configuring a database, defining your segmentation settings, and tailoring the results by removing customers or creating custom threshold sets for specific customer groups.
3 videos
7:01 min
Sales Insights Use customer segmentation
Discover how Customer Segmentation in Insights automatically groups customers based on purchasing behavior, helping you uncover risks and opportunities across your entire customer base. Learn how these dynamic insights support smarter decisions to improve retention, loyalty, and growth.
3 videos
8:13 min
 CRM
Manage CRM items
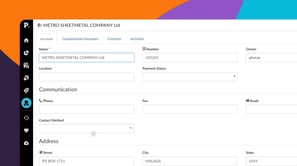
This module covers creating and editing accounts, campaigns, contacts, and pipelines in Phocas CRM, helping you and your team stay on top of customer management and sales opportunities.
4 videos
10:58 min
CRM Set up and connect CRM
This module takes you through connecting your Microsoft 365 calendar and setting up CRM account mapping. These videos introduce key steps to help keep your activities and data aligned.
2 videos
6:29 min
 Analytics (Classic)
Answer important business questions
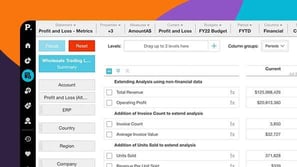
This module takes you through how to answer key business questions in Phocas Analytics (Classic). These videos cover analysing sales, tracking performance, managing inventory, and identifying opportunities using your data.
7 videos
14:53 min
Analytics (Classic) Work more efficiently
This module takes you through key grid customization features in Phocas. These videos help you tailor your workspace and improve how you work with data.
5 videos
9:35 min
Financial Statements Use financial statements for budgeting
This module takes you through key budgeting features using financial statements in Phocas. These videos help you plan and manage budgets more effectively.
2 videos
7:17 min
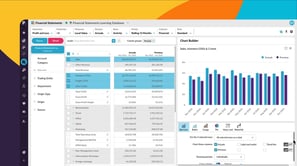 Financial Statements
Visualize financial information
Learn how you can use visualizations to explore financial statements, highlight key performance, and develop a clearer understanding of your financial position.
4 videos
11:05 min
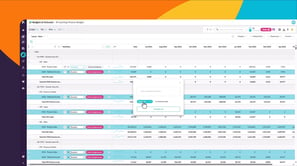 Budgets & Forecasts
Use workflows to collaborate
This module takes you through working with workflows in Budgets & Forecasts. Learn how to assign and manage tasks, contribute to the workflow, delegate responsibility, and track progress.
5 videos
17:58 min
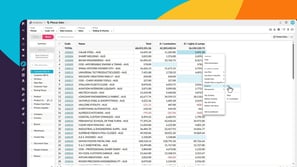 Analytics
Sales use cases
This module shows how sales teams use Analytics and Workspaces to track rep performance, spot churn risk and cross-sell gaps, and understand margin. Each video works through a real scenario.
5 videos
14:01 min
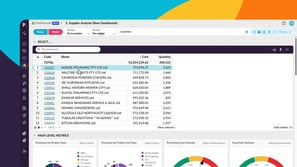 Analytics
Finance use cases
This module shows how finance teams use Analytics to chase receivables, understand margin, and prepare for reviews. Each video works through a real scenario, from aging analysis to dashboards.
5 videos
12:49 min
 Analytics
Operations use cases
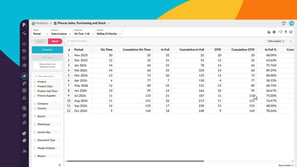
This module shows how operations teams use Analytics to manage inventory and supply. Each video works through a real scenario, including weeks of cover, stock variances, on-time in-full delivery, dead stock, and supplier negotiations.
5 videos
14:09 min
 Dashboards
Create and use dashboards
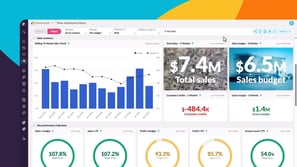
This module shows you how to use and build dashboards in Phocas. Learn how to explore and filter a dashboard, create a new one, edit its layout and widgets, and add widgets from your analysis.
5 videos
13:14 min
Filter Learning modules
reset

