Video tutorials
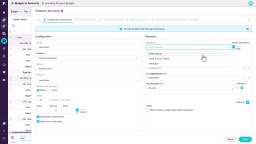
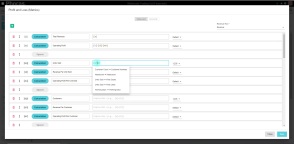
Add detail to your budget
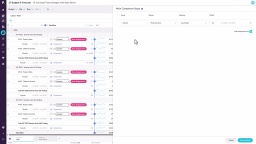
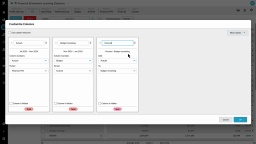
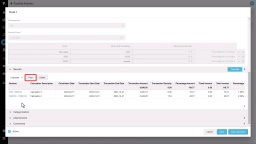
Set up comparison rows
Manage the workflow
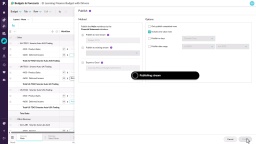
Publish a budget
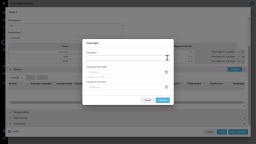
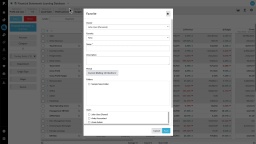
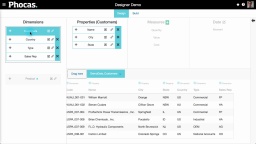
Create a budget workbook
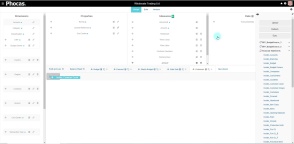
Create a nested view
With the nest view feature in Flex Modes, you can add dimensions as levels in the grid, making your data easier to interpret. This lets you see how different items contribute to the overall results and build reports where you define the hierarchy of the data on display.
Take a tour of Flex Modes
Learn how to explore your data with Flex Modes, and see how the different modes and features give you greater flexibility in how you view, compare, and analyze your information.
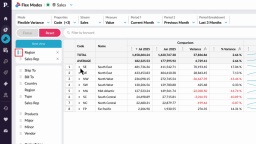
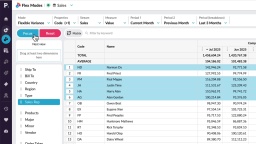
Compare data in a matrix
Learn how to filter and pivot rows at the same time, letting you view two dimensions side by side in a matrix. This makes it easy to compare your data and quickly spot any differences.
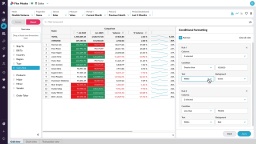
Apply conditional formatting
Filter data in Flex Modes
Use sum and working lines
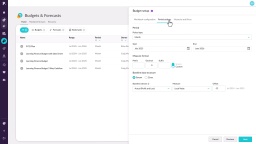
Take a tour of Budgets & Forecasts
Access the budget and your tasks
Customize your view
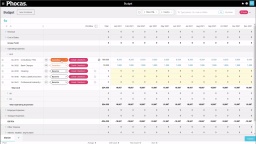
Edit values in a worksheet
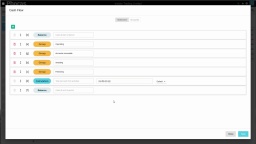
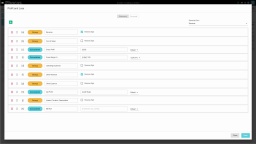
Filter a worksheet
Use formulas
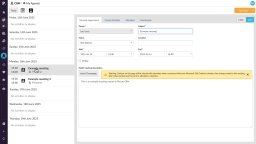
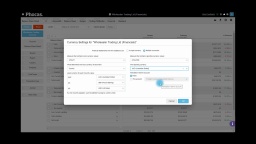
Microsoft 365 Outlook calendar integration
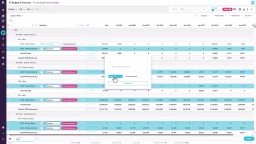
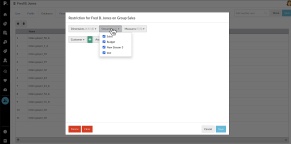
Budget by region and branch
Narrow your search by entity or property
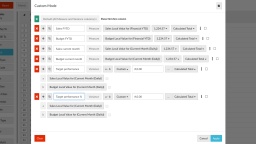
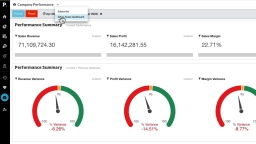
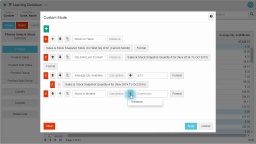
Use custom mode to show target performance
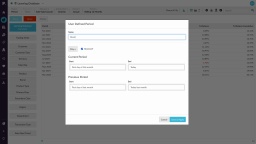
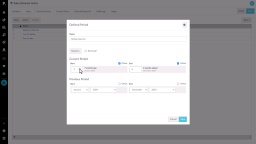
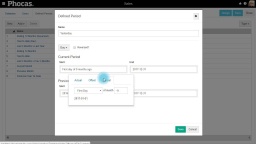
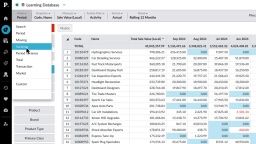
Add user-defined periods
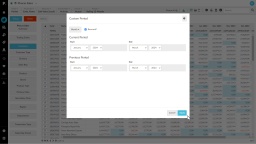
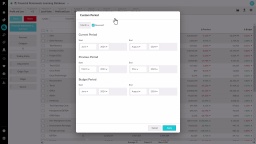
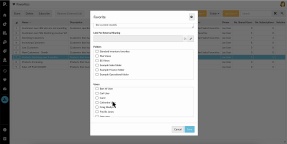
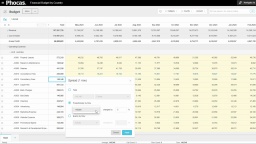
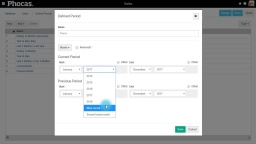
Create a custom period
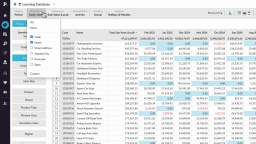
Sort and summarize your data
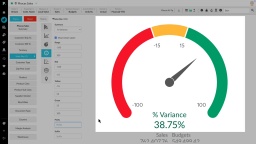
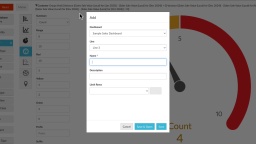
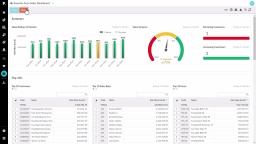
Create KPI-style gauge, summary and bullet charts
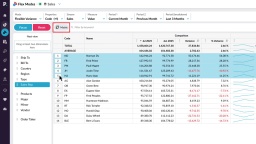
Matrix Variance and Matrix Share mode
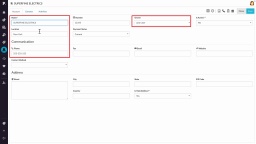
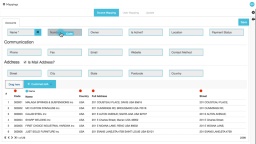
View and update accounts in CRM
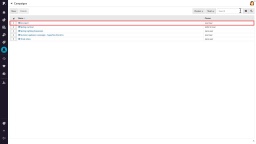
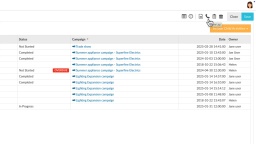
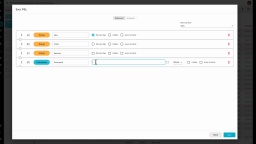
View, edit and create campaigns in CRM
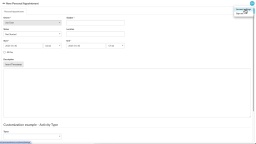
Add an activity in CRM
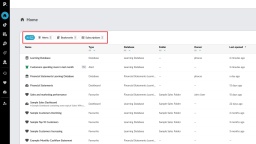
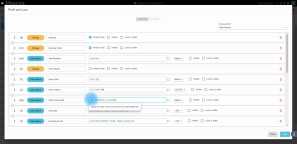
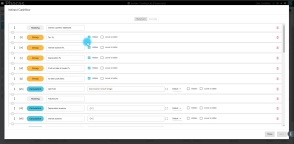
Create a financial statement
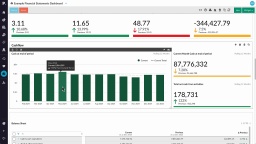
Explore and view dashboards
Monitor your team's Phocas usage
Learn how to monitor your team's Phocas usage and gain insights into the databases they’re accessing, the favorites and dashboards they’ve created, and the queries they’ve run.
Manage default database restrictions
Learn how to manage default restrictions for all users with access to a database, making it easy to set up a secure, default configuration.
Change the mode
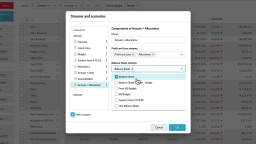
Manage streams and scenarios
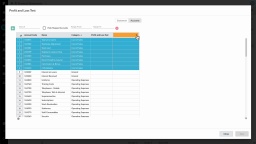
Map accounts to a group
Set up your Trial Balance Statement
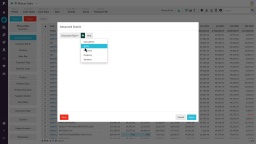
Perform an advanced search
Add custom columns to financial reports
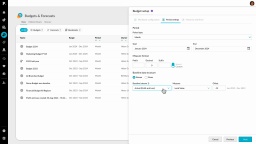
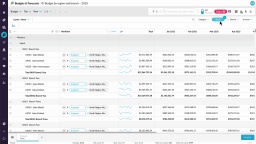
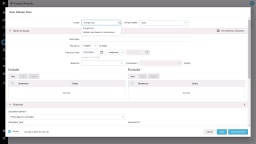
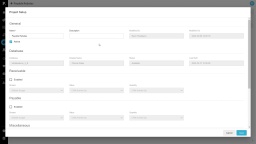
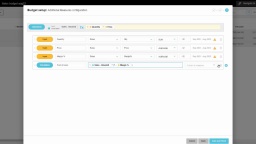
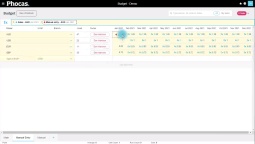
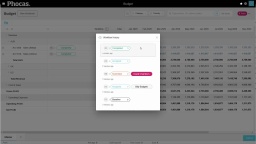
Create a budget
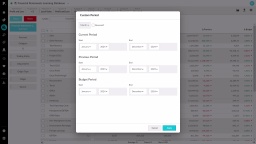
Set a custom period in Financial Statements
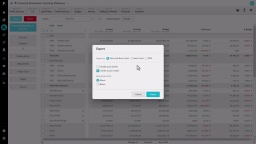
Export and copy data
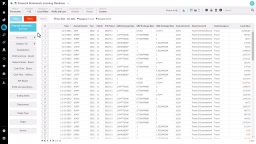
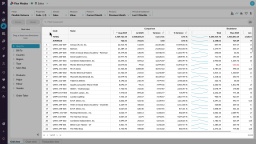
View transactions
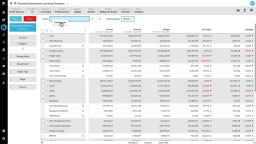
Add levels in a financial statement
View financial information in a matrix (change column groups)
Change periods (date ranges)
Filter your financial information
Phocas AI
Manage favorites, dashboards, and subscriptions
Learn how to manage and share favorites and dashboards with users, and discover how to subscribe them to email notifications to keep them updated on important changes in key data.
Retrospective rules
Pro rata rules
Posting calculation results
Create a rule - Initial setup
Find your way around Phocas
Use multiple currencies
Contribute to the workflow
Add financial analysis to a dashboard
Save and share favorites
View financial information in a chart
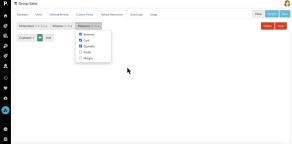
Change your view with the columns menu
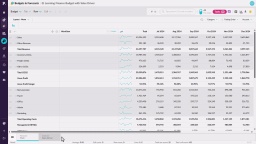
Take a tour of Financial Statements
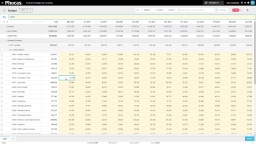
Spread totals
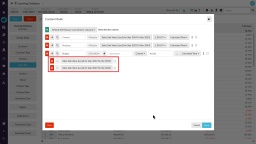
Use comparison rows
Homepage at a glance
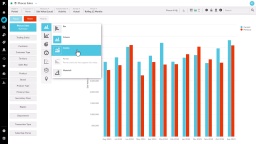
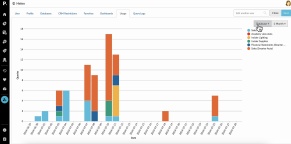
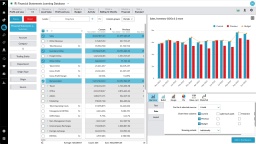
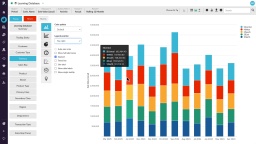
Visualize your data in a chart
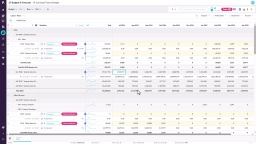
Compare data with matrix mode
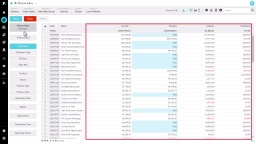
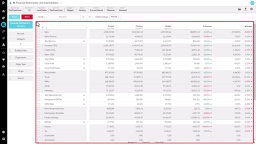
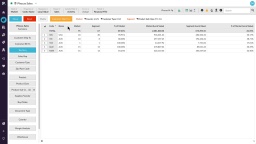
Focus on grid data
Highlight financial performance using a waterfall chart
Explore the forecast workbook
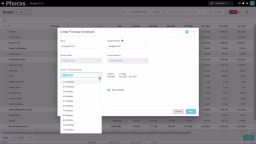
Create a forecast
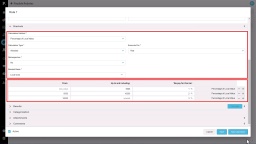
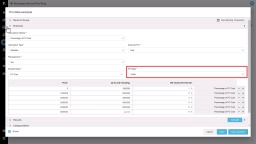
Create a sales budget with multiple drivers
Reference a single account code in calculations
Create an indirect Cash Flow statement using 'hide rows'
Combine statistical and financial data for better business insights
Bring statistical streams into a Financial Statements database
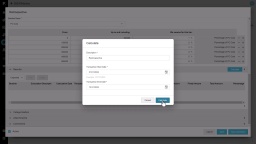
How to handle key variables, such as currency, in the budget
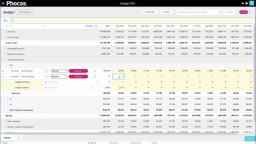
Use working rows
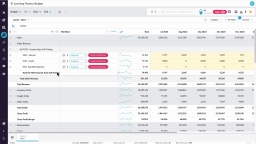
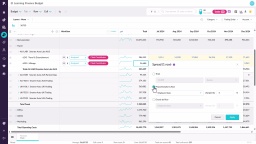
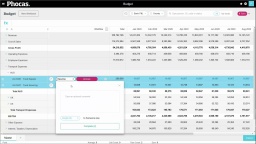
Use sum rows
Use sum rows in a budget or forecast worksheet to manually enter values that automatically sum up to the main values. Sum rows allow you to keep your workings within the worksheet, so you and other users can see how you got to the total values and update them easily.
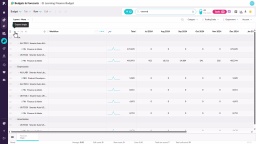
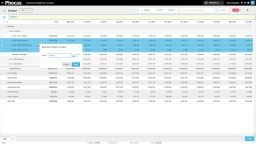
Enter values into a worksheet
Enter values into a budget or forecast worksheet to complete your tasks in the workflow. Save time using keyboard shortcuts, formulas referencing comparison data, and the copy forward and spread features.
Understanding workflow and task assignment
Customize your Cash Flow Statement
Add a custom calculation to your Income Statement
Set your default period for a database
CRM account mapping
Add levels to the grid (nesting)
My Agenda in CRM
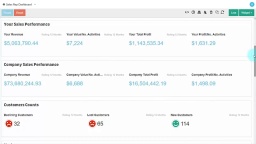
The CRM analysis dashboard
Manage contacts and leads in CRM
Compare multiple data streams
Easy budget upload
Select and change periods
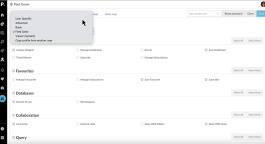
Change a single user's profile
Learn how to set up individual user accounts by applying a default profile or creating a custom, user-specific one. You'll also discover how to save time by copying an existing user’s profile, allowing you to quickly transfer permissions and make adjustments without starting from scratch.
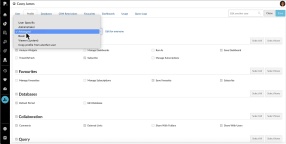
Setting site-wide profiles
Discover the default profiles you can assign, such as Administrator, Advanced, Basic, and Viewer, and find out how you can create custom profiles to better suit your needs.
Use Market Mode to analyze market penetration

Add and manage folders
Learn how to organize user favorites and dashboards into folders within a database. Discover how to create, rename, or delete folders and manage access permissions for each one.
Configure your chart options
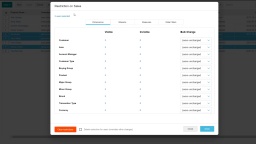
Update users in bulk
Learn how to save time by applying settings, permissions and database restrictions to multiple users at once using Bulk Update. This is often the next step after importing users.
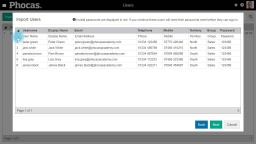
Importing users with CSV Import
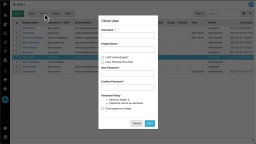
Clone a user
Discover how the Clone feature allows you to quickly create a new user by copying the settings from an existing user, saving you time and eliminating the need to manually configure everything from scratch.
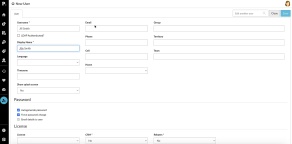
Add a new user in Phocas
This video for Phocas administrators takes you through some simple steps to create a new user in Phocas, including assigning a profile and giving access to a database.
Add a defined period using Dynamic Month option
In this video for administrators, Tina shows how to use the Dynamic Month offsets option to add to the Period menu, with a date range that updates each new calendar or financial year.
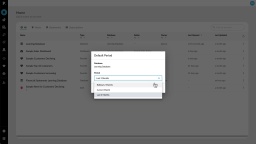
Set defined periods for a database
As an administrator, you can control which defined periods (date ranges) appear in the Period dropdown for each database in Phocas. Learn how to create a new period with a dynamic 'offset' date range for automatic updates, or select from a list of pre-built periods.
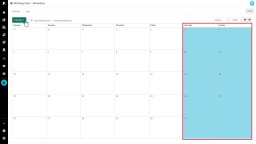
Create a working days calendar
Learn how to create a working days calendar to exclude non-working days, such as weekends and public holidays, for more accurate average daily values for your users.
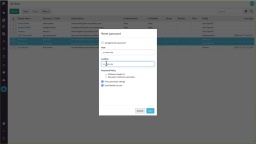
Reset and expire passwords
Learn how you can reset user passwords for single or multiple users, and force users to change passwords at their next login.
Add a defined period using Special Offsets (days)
In this video for administrators Tina shows how to add a defined period using a special offset that matches a day with a corresponding day in a previous month.
Set user restrictions
Learn how to apply user restrictions in Phocas to control what data individuals or groups can access, so you can ensure users only see the information relevant to their role.
Set a dashboard as your home page
Create an interactive dashboard
Discover dashboards
Forecast months of stock on hand (custom mode)
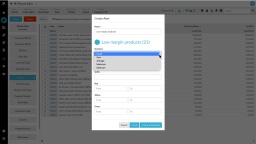
Create a 'low margin' alert
Show positive or negative variance
Design your own database
Combine inventory and sales to find dead stock
Generate a budget based on previous sales (custom mode)
What did I sell yesterday? (using transaction mode)
Examine accounts receivable over 90 days
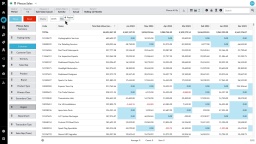
Track sales rep performance against budget
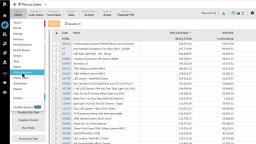
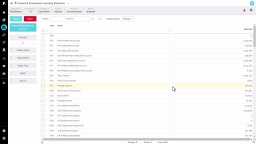
Explore the Phocas grid
Save useful data as a favorite
More options for viewing data
Change your data format
Gain more screen space and other tips
Hmmm...
We couldn't find any matches "".
Double check your search for typos or spelling errors - or try a different search term.
 Help & support